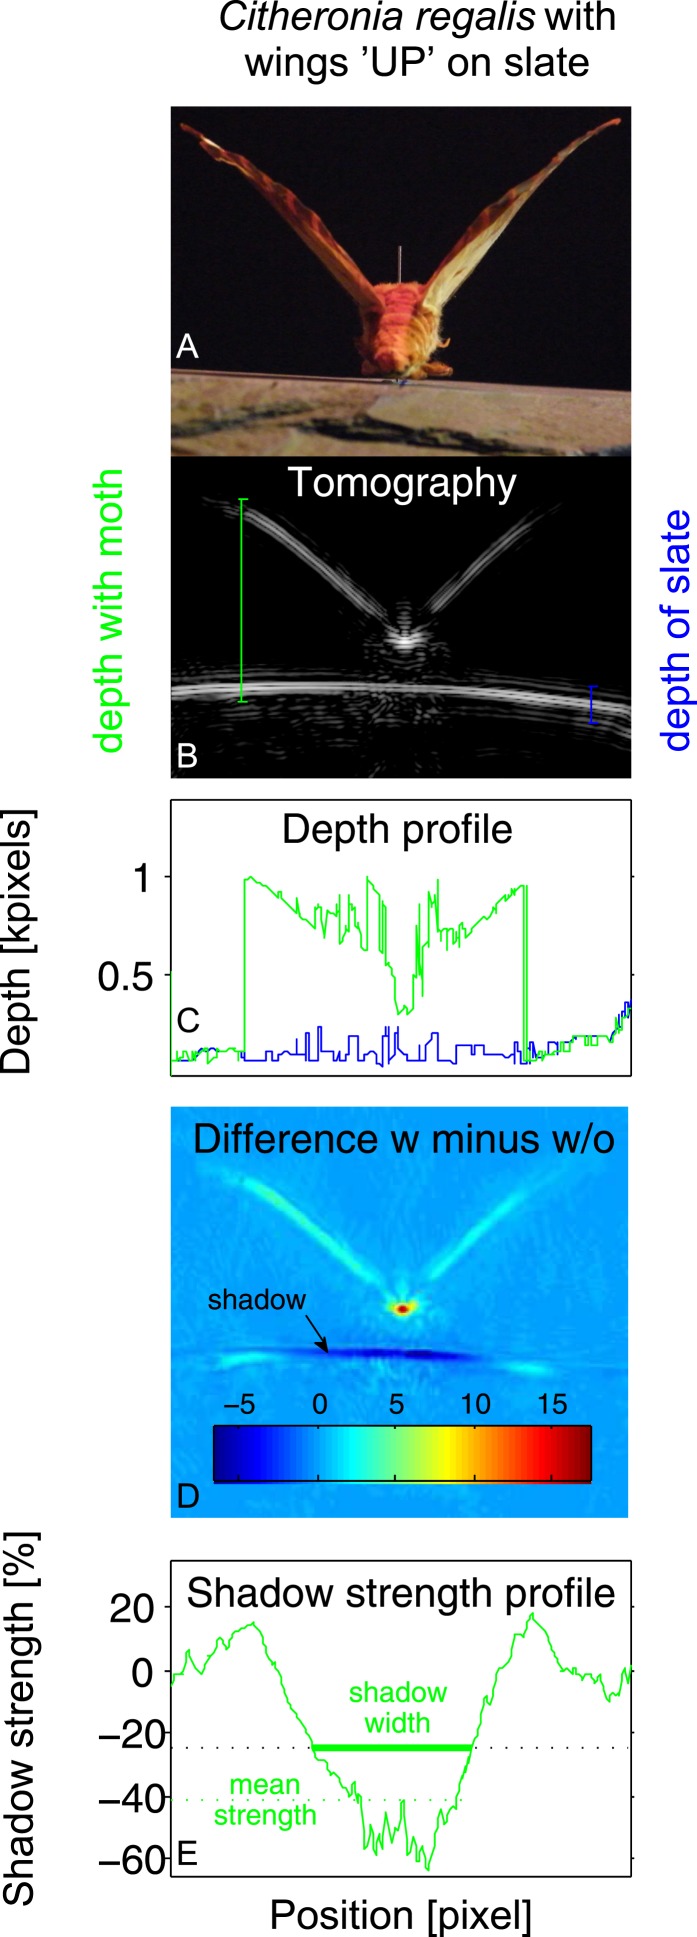
Figure 2. Example of tomography analysis for Citheronia regalis on slate with wings in ‘UP’ position.
(A) Photograph from rear of moth. (B) Tomography. Coloured vertical lines indicate example depth measurements (‘with moth’ in green; ‘without moth’ in blue). (C) Depth profile for substrate with (green) and without (blue) moth as a function of measurement angle. (D) Subtraction of tomographies with (w) and without (w/o) moth. Colour indicates absolute difference. (E) Strength of the shadow in percentage (%) difference to without moth as a function of measurement angle. Shadow size is measured as all angles where the shadow strength is at least 25% below the substrate without a moth. Overall shadow strength is the mean shadow strength over the entire shadow.

