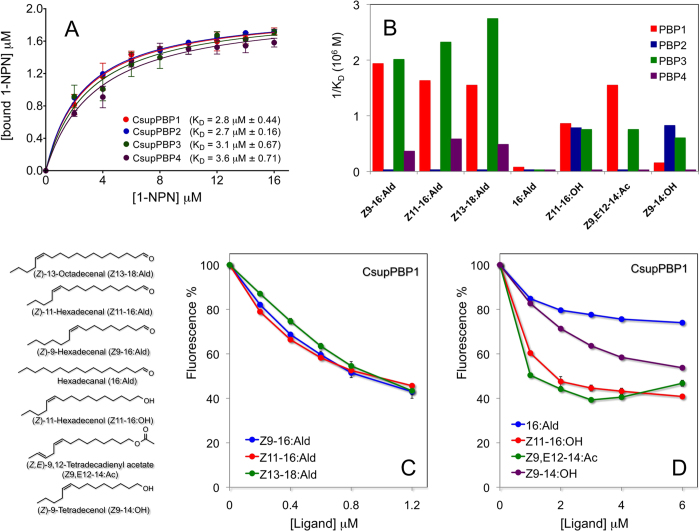
Figure 2. Ligand binding assay of CsupPBPs.
(a) Binding curves of 1-NPN to CsupPBPs (A) and competitive binding curves of CsupPBP1 to sex pheromone components (C) and analogs (D). Displacement curves for CsupPBP2, CsupPBP3 and CsupPBP4 are reported in Figure S1. Experiments with 1-NPN and with competitors were performed in triplicates and mean values and standard errors are reported. The Prism software was used to analyse the data and plot the binding curves Panel (B) reports in graphical form the affinities of the four PBPs to the seven ligands. For a more immediate visualisation, the reciprocal of dissociation constants have been plotted. Structures of the ligands utilised are also reported in the same figure.

