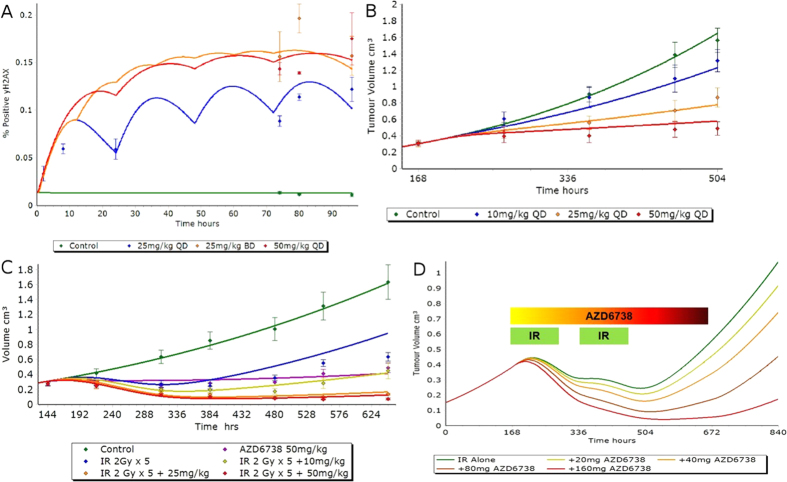
Figure 6.
(A) Observed (data points, n = 5) and simulated (solid lines) xenograft γH2AX biomarker kinetics following repeat dosing of AZD6738. (B) Observed (data points, n = 10) and simulated (solid lines) xenograft tumor growth following repeat dosing of AZD6738. (C) Observed (data points, n = 10) and simulated (solid lines) LoVo derived mouse xenograft tumor growth following repeat dosing of AZD6738 and 5 days of 2 Gy ionizing radiation. (D) Model simulation of tumor growth under conditions of 5 days of daily 2 Gy radiotherapy for 3 weeks in combination with varying dose of AZD6738 therapy, followed by 1 week of wash-out. Green bars indicate two sets of daily IR exposure over 5 days and the colored bar indicates the 3 weeks of AZD6738 therapy. Error bars represent standard error of the mean. QD = Once daily dosing, BD = Twice daily dosing.

