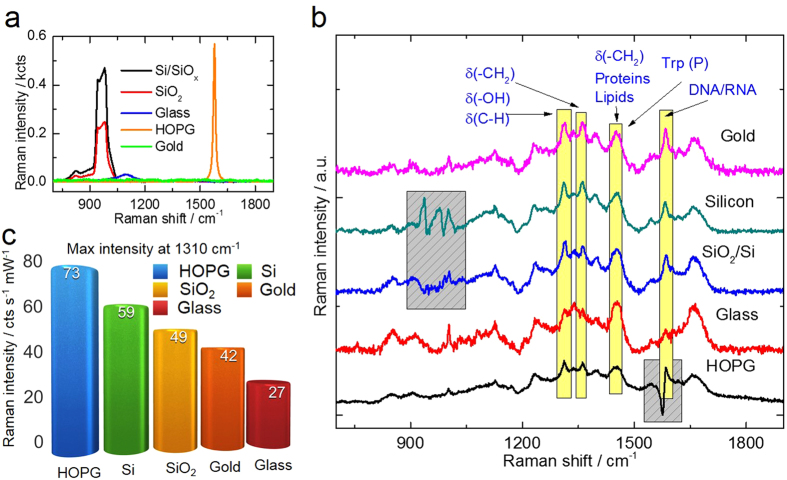
Figure 2.
(a) Raman spectra of the five substrates used for the Raman spectroscopy analysis of yeast cells: silicon with native 2–3 nm layer of SiOx; 100 nm SiO2 on Si; objective glass slide; highly oriented pyrolytic graphite (HOPG), and gold. A 514.5 nm laser was used at 2 mW power, acquisition time 10 min. (b) Raman spectroscopy results of the yeast deposited on the different substrates. The grey boxes show the spectral regions overlapping with the (subtracted) substrate signal. Trp refers to tryptophan. (c) Maximum intensity of the band at 1310 cm−1 for the different substrates.

