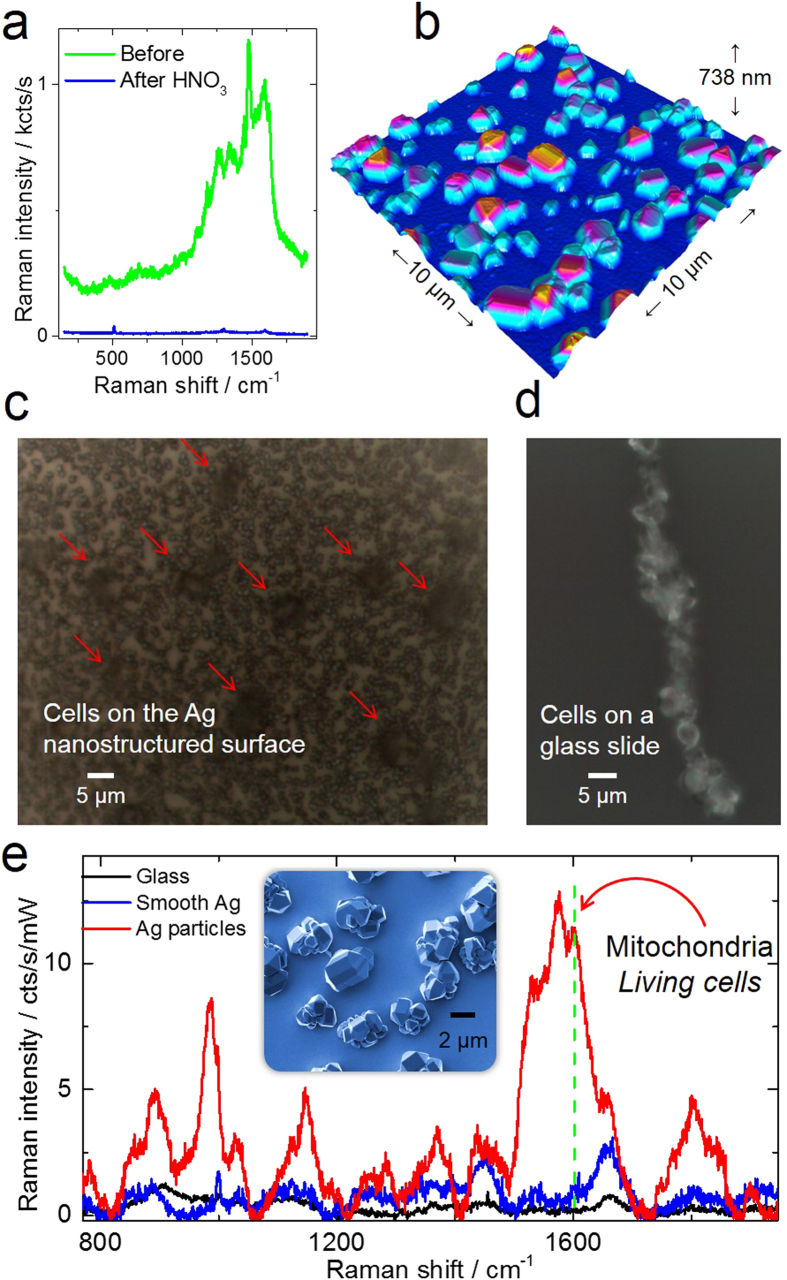
Figure 4.
(a) Raman spectra of a silver SERS substrate before and after cleaning in a diluted HNO3 solution; (b) the AFM visualization of the nanostructured silver substrate; (c) Selective single-cell attachment on the nanostructured Ag substrate is observed as compared to (d) the multiple cell aggregate formation on the glass substrate. (e) Raman spectra comparison of yeast cells deposited on a smooth Ag surface, glass, and on Ag particles. The inset shows a SEM image of some Ag nanocrystals.

