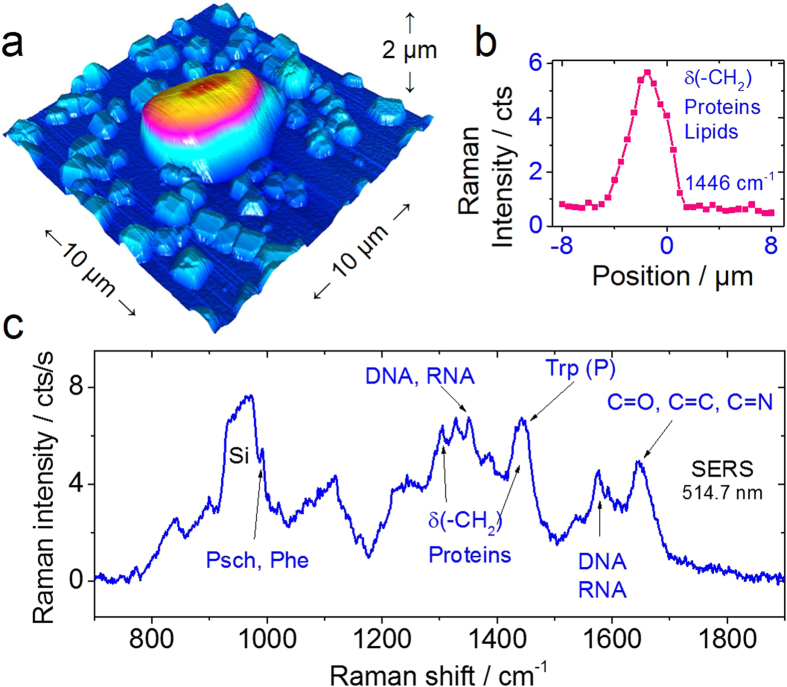
Figure 5.
(a) Atomic force microscopy image of a single cell on the silver nanoparticle substrate. (b) Raman line scan showing the spatial distribution of the CH2 vibration at 1446 cm−1 related to proteins and lipids. (c) Raman spectrum of a single cell using SERS, the high enhancement even makes the bands visible at the same level as the silicon substrate allowing the observation of the phenyl band that was previously masked. No substrate background subtraction was performed in this case.

