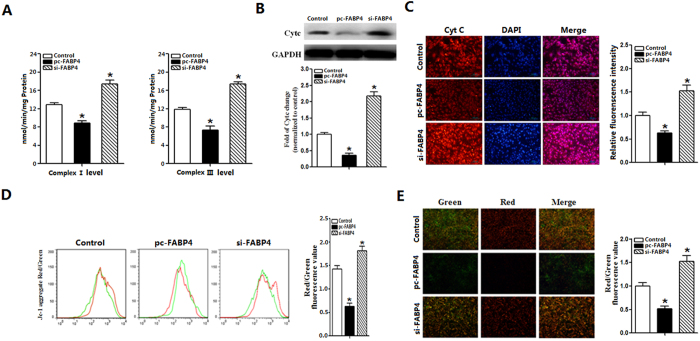
Figure 5. FABP4 reduced mitochondrial respiratory activity membrane potential.
(A). The activities of mitochondrial complex I and III after transfection with FABP4, pre-incubated cells with 100 nM leptin for 24 h (n = 6). (B). The expression of Cyt C after transfection with FABP4, pre-incubated cells with 100 nM leptin for 24 h (n = 6). (C). Images of adipocytes Cyt C immunofluorescent staining after transfection with FABP4, pre-incubated cells with 100 nM leptin for 24 h, Red Scale bar: 100 μm (n = 6). (D). Cells were analyzed by flow cytometry with JC-1stainning after transfection with FABP4, pre-incubated cells with 100 nM leptin for 24 h (n = 6). (E). Images of adipocytes stained with immunofluorescent of JC-1 under a fluorescence microscope after transfected with FABP4, pre-incubated cells with 100 nM leptin for 24 h, Scale bar: 100 μm (n = 6). The level of total GAPDH was determined as loading control. pc-FABP4: FABP4 overexpression vector; si-FABP4: FABP4 shRNA vector; control: pcDNA 3.1-vector. Values are means ± SD. vs. control group, *p < 0.05.

