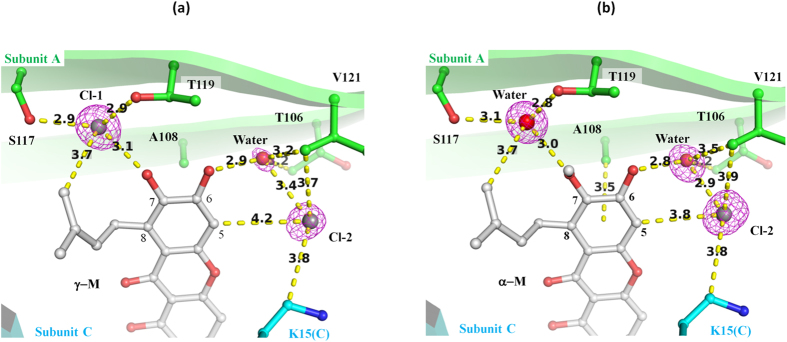
Figure 4. The hydrogen-bond network of chloride ions and water molecules.

Atomic interactions can be seen around the A-ring of γ-M (a) and α-M (b). The omit maps were contoured at 3.3 σ and are shown as a magenta-colored mesh. The carbon atoms of subunits A and C and the ligands are colored in green, cyan and silver, respectively. The oxygen, nitrogen and chloride are colored red, blue and gray, respectively. The hydrogen bonds and CH∙∙∙π interactions are indicated as yellow dashed lines.
