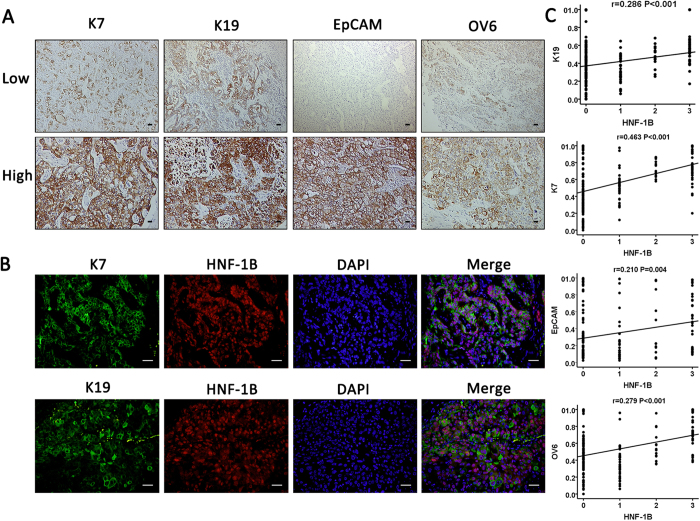
Figure 3. Expression of HNF-1B in HCC is positively correlated with expression of HPCs and biliary markers.
(A) Representative images of HPCs markers (EpCAM, OV6) and biliary markers (K7, K19) expression (sacle bar = 100 μm). (B) Representative images of double staining of HNF-1B and K7, K19 (sacle bar = 100 μm). (C) The HNF-1B expression is positively correlated with K7, K19, EpCAM, and OV6 expression. Spearman correlation analysis provides correlation coefficient (r) and P-value.

