
Figure 4. Absorbance changes of the dye phenol red associated with proton uptake during O2 reduction.
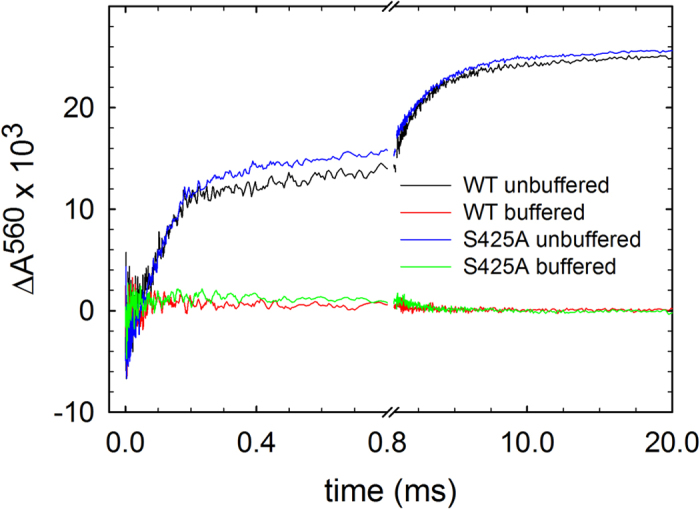
The same reaction as in Fig. 3 was studied, but at 560 nm where the main contribution is from the dye. The signal shown is a difference between that obtained without buffer and that obtained with buffer. Experimental conditions after mixing: ~0.6 μM reacting enzyme in 100 mM KCl, pH 7.8, 0.05% DDM, 40 μM phenol red, 100 μM EDTA, 1 mM O2 at ~22 °C. The measurements were then repeated in the presence of 0.1 M HEPES (without KCl) and these absorbance changes were subtracted from those obtained with the un-buffered solution yielding absorbance changes that were only associated with proton uptake. The shown traces are average of 15 experiments.