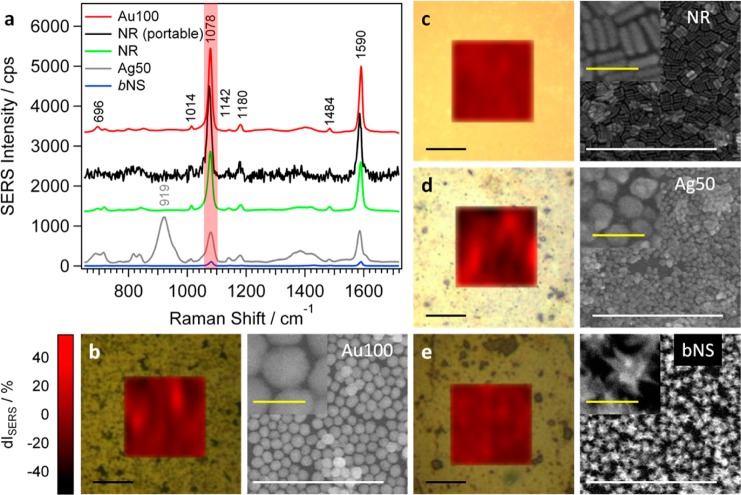
Figure 5.
(a) Averaged SERS spectra of 4-MBA (10 μM) on Au 100 (b), AuNRs (c), Ag 50 (d), and bAuNSs (e). The corresponding SERS maps for the signal at 1078 cm–1 (red-shaded area in (a) as a function of the deviation from the average intensity dI (in %), together with representative SEM images of the assemblies before analyte incubation. The black SERS spectrum in (a) corresponds to the average of three 4-MBA spectra on the AuNR sample measured with a portable Raman spectrometer.

