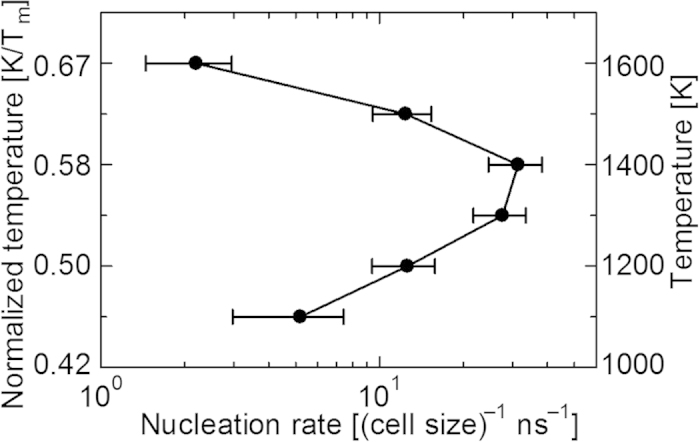
Figure 3. Nucleation rate as a function of temperature.

The average number obtained from five replicate calculations for each temperature is plotted with error bars showing the standard deviation.

The average number obtained from five replicate calculations for each temperature is plotted with error bars showing the standard deviation.