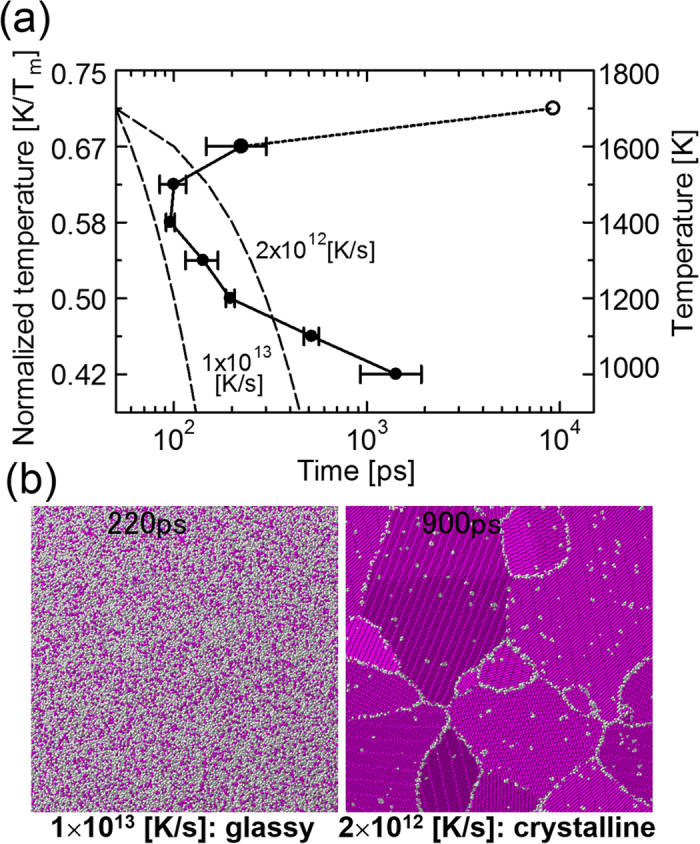
Figure 4.

(a) Time-temperature-transformation (TTT) diagram. The average number obtained from five replicate calculations for each temperature is plotted (filled circles) with error bars showing the standard deviation except for the case of 0.71Tm. For 0.71Tm, the actual measurement value from one calculation is plotted (open circle). (b) Snapshots of atomic configuration after the continuous cooling transformation (CCT) along dashed lines in (a), which represent cooling rates of 1 × 10¹³ and 2 × 10¹² K/s, respectively.
