Figure 1.

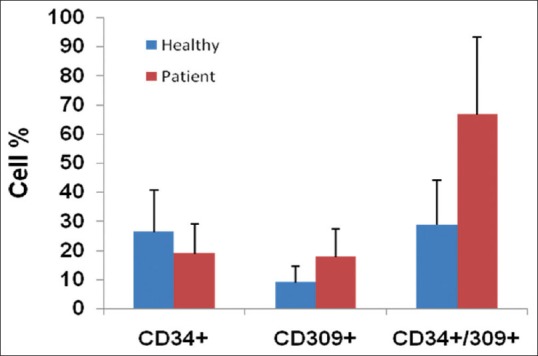
Cells analysis from the healthy controls and optic neuritis patients. The number of CD34+ CD309+ cells/ml compared in both groups. Results are expressed as mean ± standard deviation; *P ≤ 0.05

Cells analysis from the healthy controls and optic neuritis patients. The number of CD34+ CD309+ cells/ml compared in both groups. Results are expressed as mean ± standard deviation; *P ≤ 0.05