
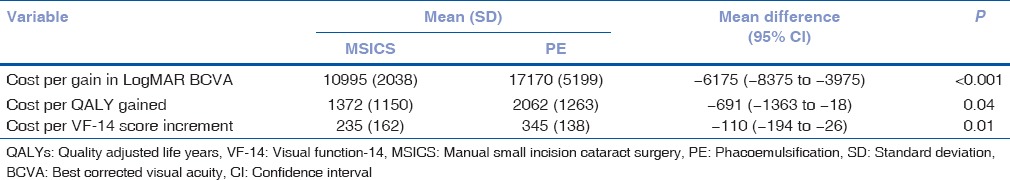
Table 5.
Comparison of cost per unit gain in LogMAR BCVA, VF-14 score and QALYs in MSICS (n=26) and PE (n=26) groups
Official websites use .gov
A
.gov website belongs to an official
government organization in the United States.
Secure .gov websites use HTTPS
A lock (
) or https:// means you've safely
connected to the .gov website. Share sensitive
information only on official, secure websites.
Comparison of cost per unit gain in LogMAR BCVA, VF-14 score and QALYs in MSICS (n=26) and PE (n=26) groups