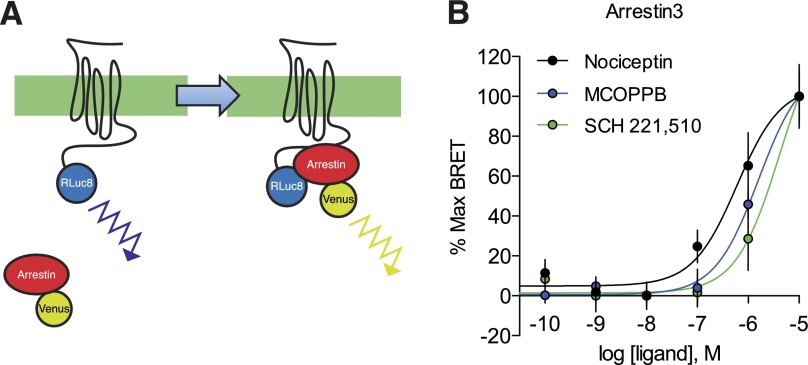
Fig. 3.
Quantification of ligand-induced arrestin recruitment at NOPR. (A) BRET constructs were used to assess recruitment of arrestins to NOPR upon activation. Rluc8 luminescence (460 nm) is capable of exciting the Venus-tag on arrestin-2/3 resulting in a distinct emission wavelength (528 nm). Ligand-induced BRET between NOPR-Rluc8 and indicates arrestin recruitment to the receptor. Differences in recruitment level can be measured quantitatively by increase in fluorescence over luminescence. (B) Normalized concentration response curves for arrestin-3 recruitment to NOPR show rank order of potency for tested agonists. All points are mean ± S.E.M., n = 3–6, triplicate samples.

