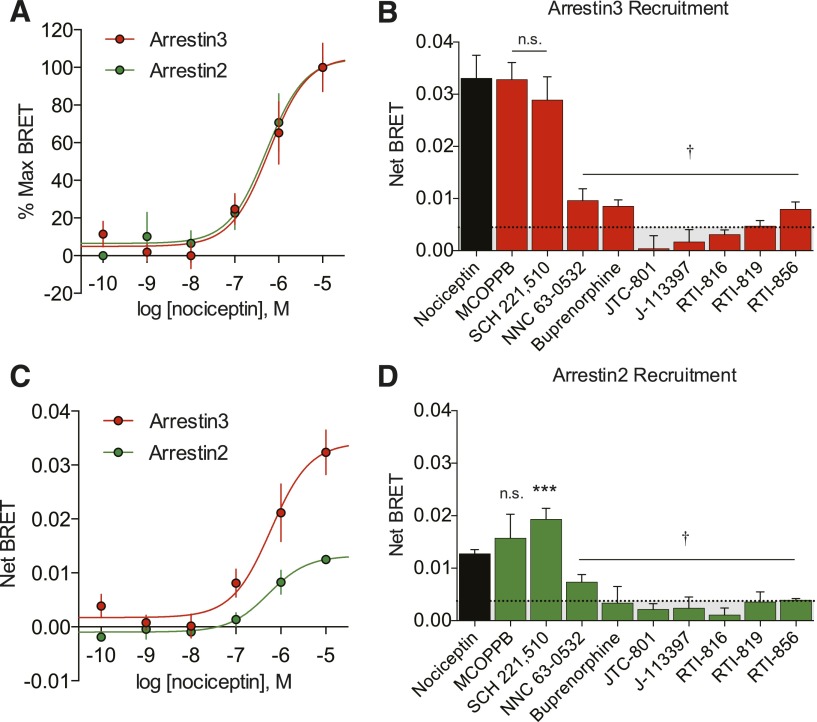
Fig. 4.
Arrestin recruitment profiles of NOPR ligands. (A) Despite the differences in efficacy, normalized CRCs of nociceptin-induced arrestin recruitment virtually overlap, showing similar potencies. (B and D) Maximum NOPR ligand-induced arrestin-3 and -2 recruitment shown as net BRET. MCOPPB and SCH 221,510 show full agonist activity and are not significantly different from nociceptin, while all other ligands tested show no significant difference from vehicle controls but are statistically different from nociceptin (†). Ligand-induced arrestin-2 recruitment is similar to arrestin-3, except SCH 221,510, which is significantly different from both nociceptin and vehicle control. (C) Concentration-response curves showing different maximum efficacies, but similar potencies in nociceptin-induced arrestin-2/3 recruitment. All points are mean ± S.E.M. (***P ≤ 0.001, one-way analysis of variance, Tukey’s least significant difference post-hoc test, n = 3–6, triplicate samples). n.s., not significant.

