Fig. 6.
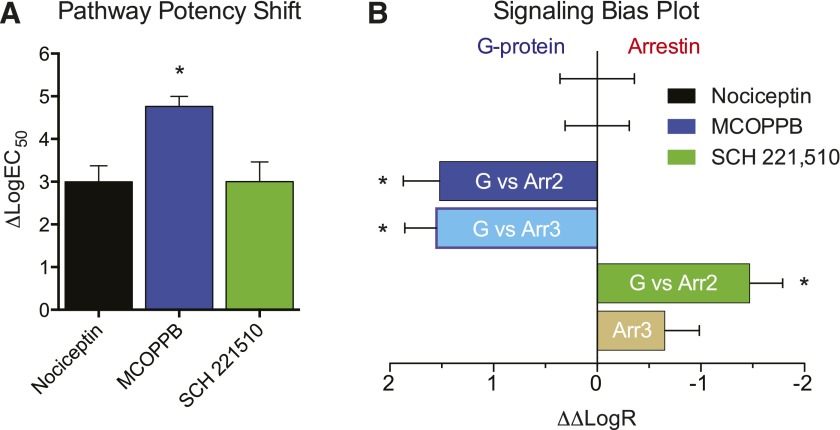
Potency shift and calculated transduction coefficients. (A) Comparison of pathway potency shifts (ΔlogEC50) shows a unique ∼100-fold shift (lower) in potency for agonist MCOPPB that is not conserved for nociceptin or SCH 221,510. (B) Bias plot showing signaling bias in terms of G protein signaling for NOPR ligands. After combining individual pathway biases (Supplemental Fig. S3), MCOPPB consequently shows a significant G protein bias, while SCH 221,510 resolves no overall pathway bias. All points are mean ± S.E.M. (*P ≤ 0.05, compared with reference ligand).

