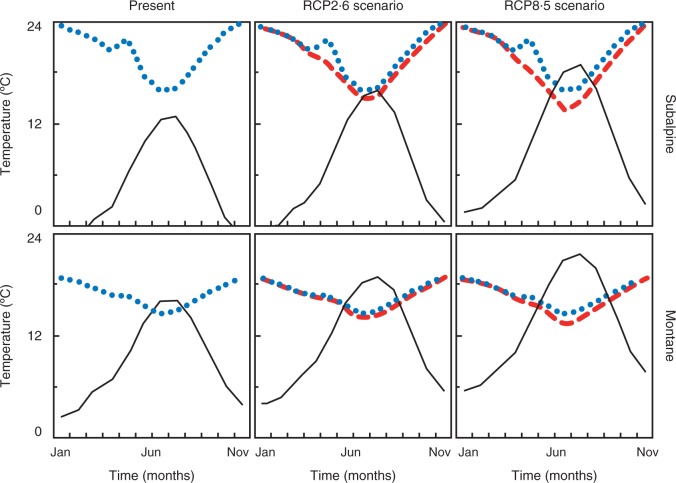
Fig. 3.
Simulated environmental temperature and base temperature (Tb) for germination at present and under the RCP2.6 and RCP8.5 scenarios. Each panel shows the results for one population under a given scenario. The solid line is the environmental monthly average temperature, the dotted line represents Tb projected on the basis of the present diurnal thermal amplitude (ΔT) and the broken line is for Tb projected in relation to the ΔT of the scenario.

