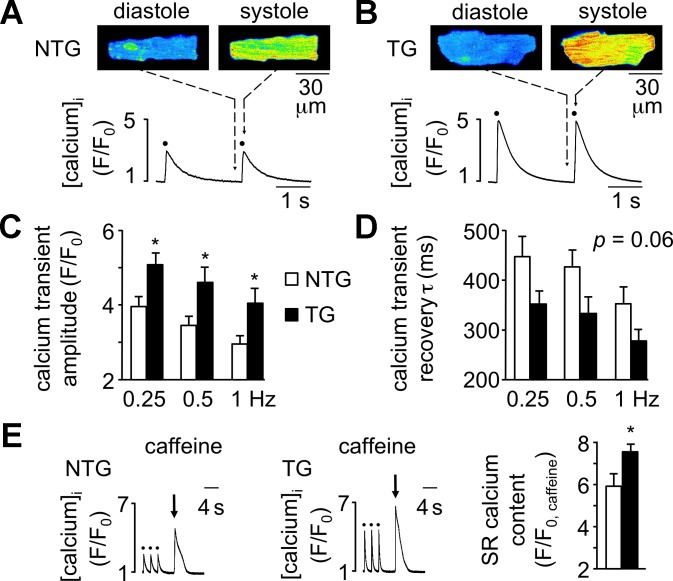
Fig. 2.
Cardiomyocytes of Q510E-SHP2 TG mice exhibit enhanced Ca2+ signaling during excitation-contraction coupling. A and B: example two-dimensional laser-scanning confocal fluorescence images (fluo-4 AM, top) and F/F0 profiles (bottom) of Ca2+ responses before (cellular diastole) and immediately after 0.5-Hz action potential stimulation (cellular systole, stimuli marked with solid circles in profiles) in cardiomyocytes from 4-wk-old NTG and TG mice. F is the peak fluorescence in response to electrical stimulation or caffeine application, and F0 is the baseline fluorescence C: summary data showing significantly enhanced Ca2+ transients during excitation-contraction coupling in TG cardiomyocytes (solid bars, n = 9 cells from 4 mice) compared with NTG cardiomyocytes (open bars, n = 11 cells from 4 mice). D: recovery of the Ca2+ transient [transient time constant (τ)] trended toward shorter times in cardiomyocytes of TG mice (solid bars), although this finding did not reach statistical significance (P = 0.06). E: sarcoplasmic reticulum (SR) Ca2+ content as assessed by rapid application of 10 mM caffeine (arrow) after cessation of a 0.5-Hz pacing train (solid circles) in NTG and TG cardiomyocytes. Bar graphs show summary data demonstrating elevated SR Ca2+ content in TG cardiomyocytes (solid bars; n = 7–8 cells from 4 mice per group). *P < 0.05 vs. NTG cardiomyocytes.

