Fig. 4.
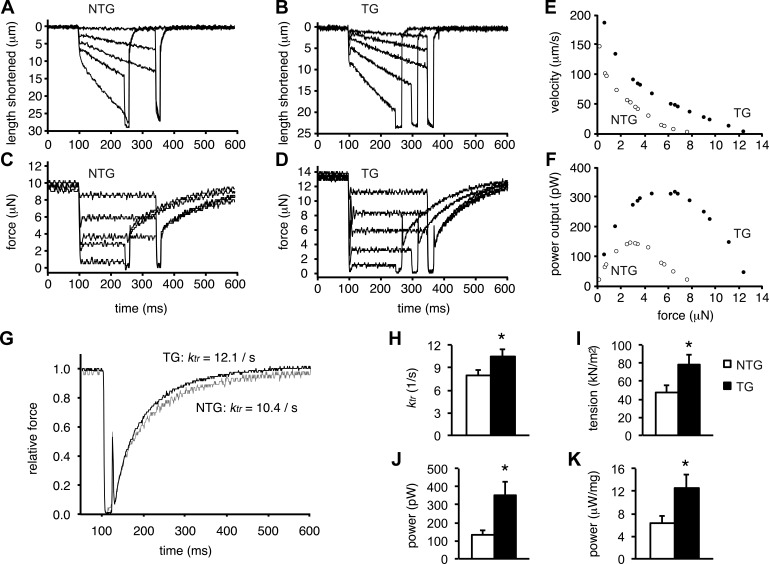
Q510E-SHP2 expression increases force and power generation in skinned cardiac myofibers. A–D: force clamps (for 150–250 ms) and length traces during maximal Ca2+ activation of a cardiomyocyte from NTG and TG mice, respectively. E and F: force-velocity and power-load curves of a myocyte (at maximal Ca2+ activation) from a NTG mouse heart (open circles) and a TG heart (closed circles). G: force redevelopment traces after a slack-restretch maneuver of a NTG cardiomyocyte (shaded trace) and a TG cardiomyocyte (solid trace) during maximal Ca2+ activation. TG cardiomyocyte preparations exhibited faster force redevelopment kinetics than compared with NTG cardiomyocyte preparations. ktr, rate constant of force development H–K: bar plots summarizing rate constants, tension, and power (both absolute and normalized for cardiomyocyte size) generated by cardiomyocyte preparations from NTG and TG hearts. In all bar graphs, n = 9. *P < 0.05 vs. NTG cardiomyocyte preparations.

