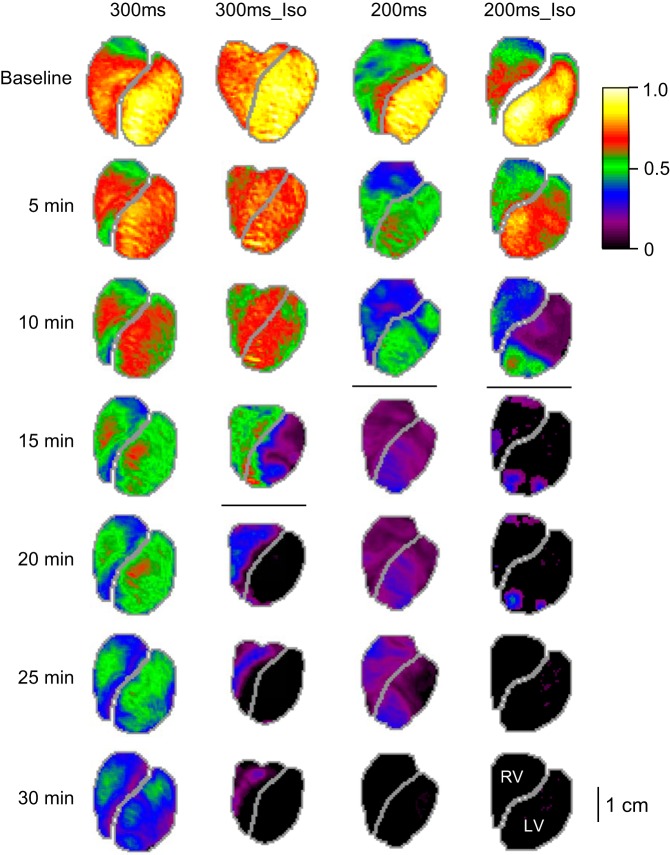
Fig. 2.
Representative examples of the progressive decline in dV/dtmax over time of ischemia in 4 tested groups: 300ms, 300ms_Iso, 200ms, and 200ms_Iso (see methods for definitions). Each column represents an experimental group; each row represents a time point in ischemia. The values of dV/dtmax in each pixel are corrected for the background fluorescence and normalized to the maximal value in the baseline map. The horizontal lines in each column indicate the 5-min interval in which ventricular fibrillation (VF) initiation took place. In the 300ms experiment (the leftmost column) VF started at 33 min of ischemia. Note that both the higher pacing frequency (the shorter pacing cycle) and β-adrenergic stimulation with isoproterenol tended to accelerate electrical depression and the onset of VF.

