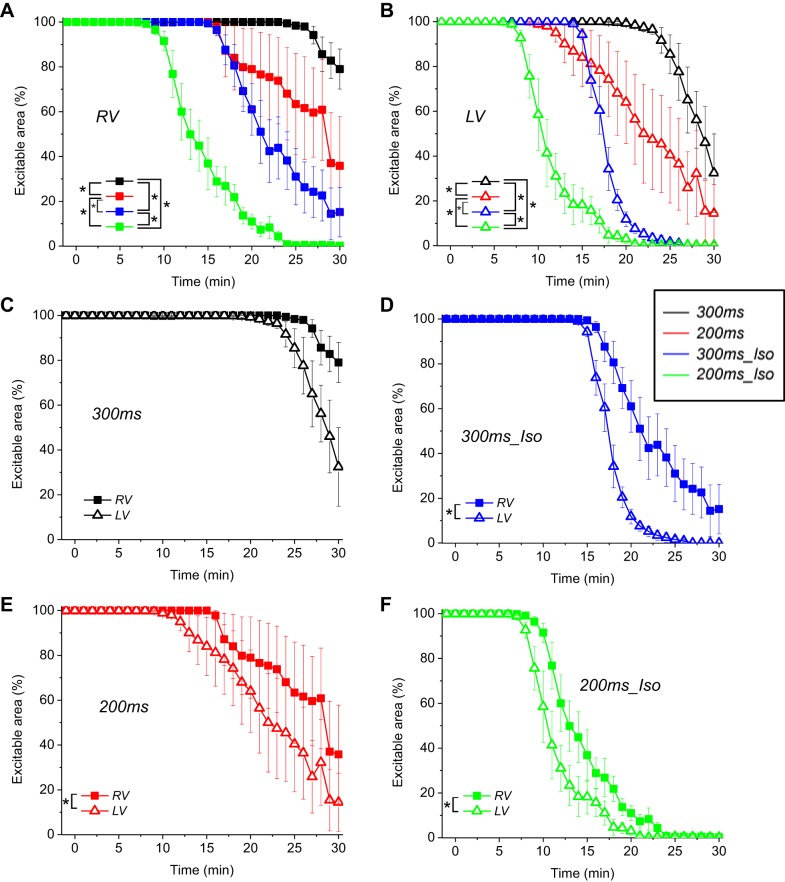
Fig. 4.
The time course of excitability loss during ischemia. Averaged data from 300ms, 200ms, 300ms_Iso, and 200ms_Iso groups (the same as in Fig. 3, C and D) are shown disregarding the presence or absence of VF. A and B: percentage of the excitable area in the RV and the LV, respectively, is plotted for each group as a function of ischemia time. Note that rapid pacing and βAS - independently and in combination - promote electrical failure during ischemia. C–F: RV and the LV curves of excitability loss in individual experimental groups (as indicated) are superimposed to highlight the inter-chamber differences. (The curves are the same as shown in A and B, grouped differently). Note that under all experimental conditions the LV started losing excitability earlier than the RV. *P < 0.05.

