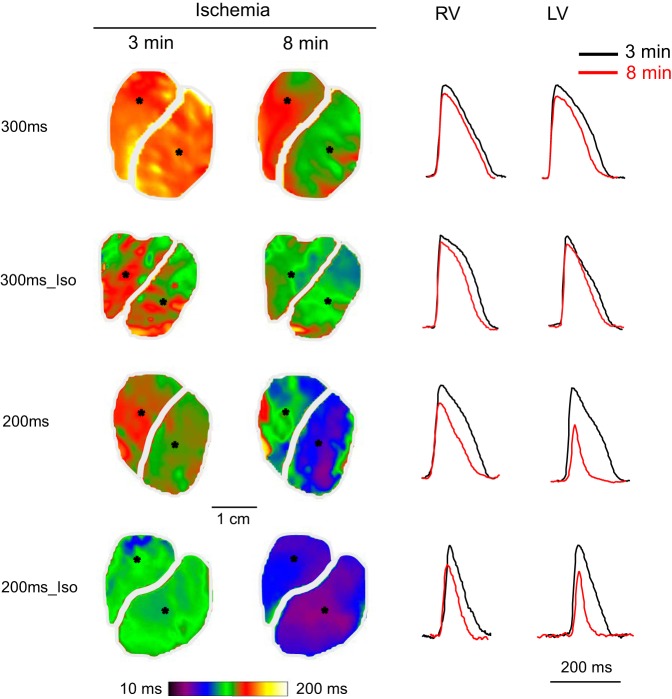
Fig. 5.
Representative examples of action potential duration at the level of 80% of repolarization (APD80) maps and individual OAPs in 4 groups (300ms, 300ms_Iso, 200ms, and 200ms_Iso) at 3 and 8 min of ischemia. Left: APD80 maps. Right: individual OAPs recorded from the pixels indicated in the respective APD maps. Rows represent experimental groups; columns represent the RV and the LV, respectively; black and red color represent 3 and 8 min of ischemia, respectively. See article for more detail.

