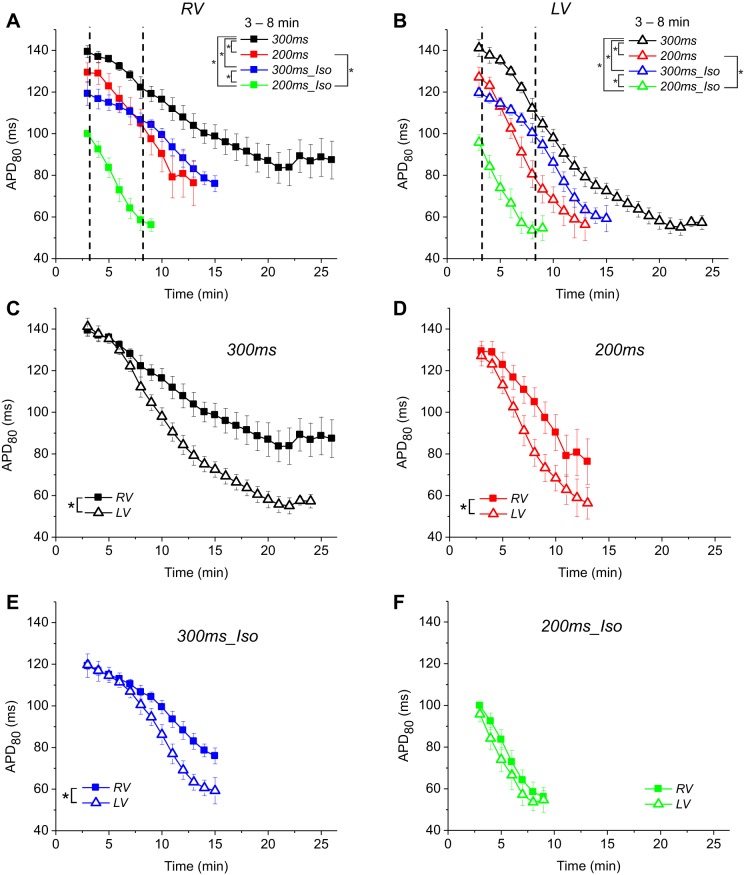
Fig. 6.
The time course of the progressive APD80 shortening during ischemia. The data are from 4 groups: 300ms (black), 200ms (red), 300ms_Iso (blue), and 200ms_Iso (green). In each experiment, the APD80 values for the RV and the LV were obtained by averaging over all pixels in the respective mapped regions. Note that APD80 measurements were not performed fort the time points before 3 min of ischemia, due to the presence of motion artifact in the optical signals in isoproterenol-treated groups, despite the use of the electromechanical uncoupler BDM. Starting from 3 min of ischemia, the motion artifact was minimal in all groups due to ischemic suppression of contractility. For all time points after 3 min of ischemia, the APD80 data are shown only if at least 3 hearts in a given experimental group remained in regular paced rhythm and maintained excitability in at least 80% of mapped regions in both the RV and the LV. A and B: time course of APD80 decline during ischemia in the RV and the LV, respectively. The comparison between groups in each chamber was performed for the time interval between 3 and 8 min of ischemia. C–F: RV and the LV curves of APD80 decline in individual experimental groups (as indicated) are superimposed to highlight the inter-chamber differences. (The curves are the same as shown in A and B, just grouped differently). In each group, the inter-chamber difference in APD80 was analyzed for all time points satisfying the criteria stated above. Note that a prominent right-to-left APD80 gradient developed in all groups except 200ms_Iso. *P < 0.05. See article for more detail.

