
FIG 3.
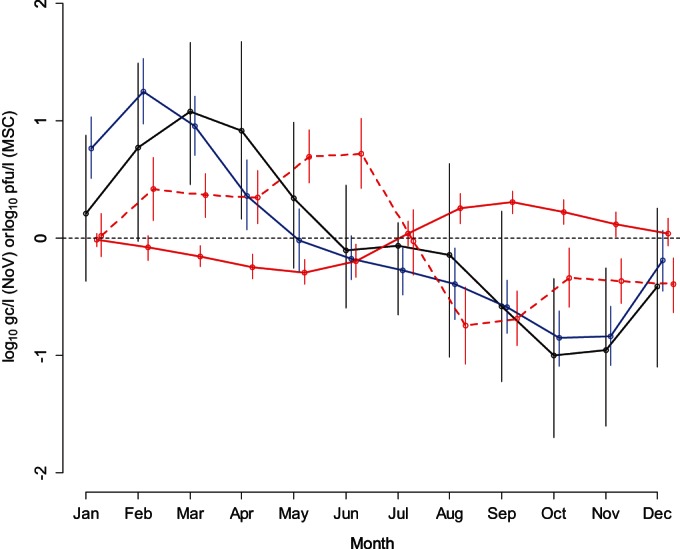
Monthly variation relative to the mean of the expected concentrations of NoV GI (black line; log10 gc/liter), NoV GII (blue line; log10 gc/liter), and MSCs (solid red line; log10 number of PFU per liter) in WWTP influent and monthly variation relative to the mean log10 reduction of MSCs (red dashed line; log10 number of PFU per liter) predicted by the model. Circles represent the medians of the posterior distributions, while segments represent the 95% CIs of the posterior distributions. As an example, the MSC mean log10 reduction was significantly lower (the month effect is positive) than the average from February to June and significantly higher than the average from August to December.