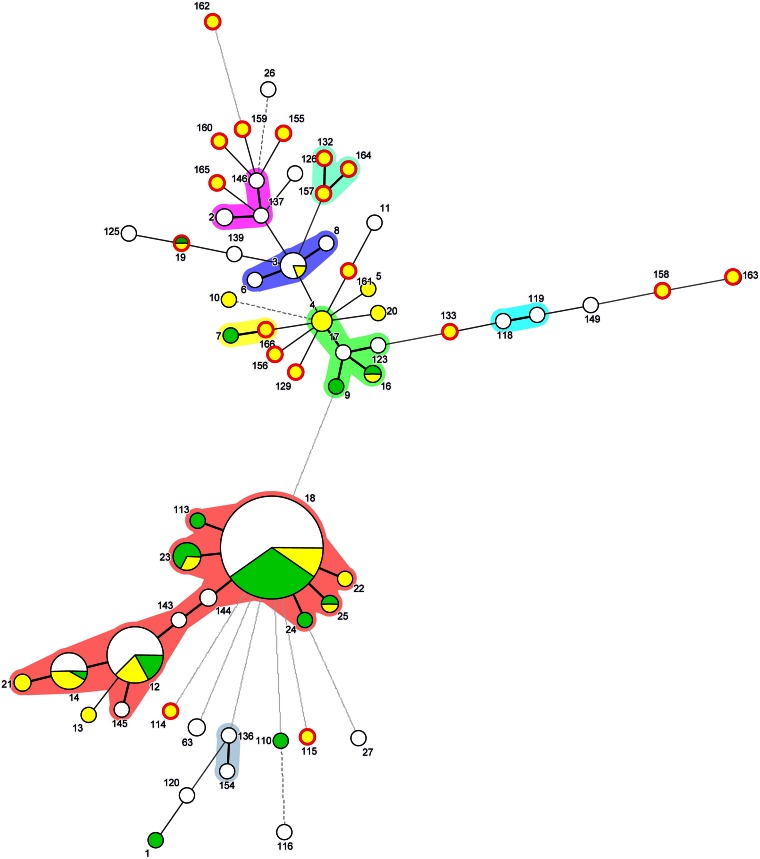
FIG 2.
Minimum spanning tree based on the MLST profiles obtained from the MLST database (last accessed 18 December 2014; http://pubmlst.org/yersinia/) and generated using BioNumerics software (Applied Maths, Sint-Martens-Latem, Belgium). The Arabic numbers indicate the ST assignment. The colored areas around the circles represent single-locus variants. The length of the connecting lines is proportional to the number of different MLST alleles. Green, isolates of human origin; yellow, isolates of animal origin; white, the origins of the isolates were not defined in the MLST database. The sizes of the circles are proportional to the number of isolates. The position of the Y. enterocolitica isolates within the population from wild boars collected during this study (including all MLSTs) is indicated by a red edge.

