

Abstract
Human noroviruses (HNoV) and hepatitis A virus (HAV) have been implicated in outbreaks linked to the consumption of presliced ready-to-eat deli meats. The objectives of this research were to determine the thermal inactivation kinetics of HNoV surrogates (murine norovirus 1 [MNV-1] and feline calicivirus strain F9 [FCV-F9]) and HAV in turkey deli meat, compare first-order and Weibull models to describe the data, and calculate Arrhenius activation energy values for each model. The D (decimal reduction time) values in the temperature range of 50 to 72°C calculated from the first-order model were 0.1 ± 0.0 to 9.9 ± 3.9 min for FCV-F9, 0.2 ± 0.0 to 21.0 ± 0.8 min for MNV-1, and 1.0 ± 0.1 to 42.0 ± 5.6 min for HAV. Using the Weibull model, the tD = 1 (time to destroy 1 log) values for FCV-F9, MNV-1, and HAV at the same temperatures ranged from 0.1 ± 0.0 to 11.9 ± 5.1 min, from 0.3 ± 0.1 to 17.8 ± 1.8 min, and from 0.6 ± 0.3 to 25.9 ± 3.7 min, respectively. The z (thermal resistance) values for FCV-F9, MNV-1, and HAV were 11.3 ± 2.1°C, 11.0 ± 1.6°C, and 13.4 ± 2.6°C, respectively, using the Weibull model. The z values using the first-order model were 11.9 ± 1.0°C, 10.9 ± 1.3°C, and 12.8 ± 1.7°C for FCV-F9, MNV-1, and HAV, respectively. For the Weibull model, estimated activation energies for FCV-F9, MNV-1, and HAV were 214 ± 28, 242 ± 36, and 154 ± 19 kJ/mole, respectively, while the calculated activation energies for the first-order model were 181 ± 16, 196 ± 5, and 167 ± 9 kJ/mole, respectively. Precise information on the thermal inactivation of HNoV surrogates and HAV in turkey deli meat was generated. This provided calculations of parameters for more-reliable thermal processes to inactivate viruses in contaminated presliced ready-to-eat deli meats and thus to reduce the risk of foodborne illness outbreaks.
INTRODUCTION
Globally, foodborne enteric viruses are the leading cause of acute gastroenteritis in humans. In particular, human noroviruses (HNoV) and hepatitis A virus (HAV) are the most important foodborne viral pathogens with regard to the number of outbreaks and the number of people affected (1–3). Scallan et al. (4), in a publication on the incidence and causes of foodborne illnesses in the United States, reported that a large number of outbreaks are caused by HNoV (58%). Additionally, relatively high hospitalization and death rates are associated with HAV infection (32% and 2%, respectively) (1, 4).
According to the U.S. Food and Drug Administration (FDA) and U.S. Department of Agriculture Food Safety and Inspection Service (FSIS), deli meat has posed the highest per annum risk of illness and death among poultry products (5). Additionally, in other studies, Gould et al. (6) and Painter et al. (7) studied surveillance and attribution of foodborne disease outbreaks in the United States from 1998 to 2008. They found that, among individual food categories, poultry was the most commonly reported food vehicle of disease, causing 17% of outbreaks of foodborne illness (6), and that the proportions of poultry-associated foodborne illnesses, hospitalizations, and deaths caused by human noroviruses and HAV were 28%, 14%, and 4%, respectively (7). In 1998 through 2002 alone, three large outbreaks were linked to the consumption of turkey delicatessen meat contaminated during processing (7). Since ready-to-eat (RTE) meat and poultry deli products can be consumed without further cooking, these products should be free of non-spore-forming pathogens following the industrial thermal process. However, they can become contaminated before packaging in the final retail wrap and thus pose a safety threat for consumers (8, 9). Viral contamination of RTE and prepared foods most frequently comes from poor hand-washing practices of food handlers after toilet use. Fecal material can be left on hands or even under nails which then can come in contact with food products (10). Handling cooked products with bare hands has been identified as a major factor for pathogen transfer to RTE foods (11), and there is presumed to be a direct correlation between the number of pathogenic organisms on a food employee's hands and the probability of microbial transfer from hands to cooked food products (12). Since the contamination most likely occurs at the surface, it seems advisable to decontaminate the outer layer of products. For this purpose, postpackage pasteurization technologies could be practiced as a method for reducing surface contamination by food pathogens (9). One of the challenges for the industry would be to assess the required time and temperature combination, which would depend on the thermal inactivation kinetics of the target microorganism (13). It has been reported that foodborne enteric viruses are more heat resistant than most non-spore-forming bacterial foodborne pathogens (14); thus, processing recommendations based on the data for non-spore-forming bacteria may not eliminate similar numbers of foodborne enteric viruses. Since there is no specific federal regulation covering the minimum time-temperature combinations for inactivating virus in contaminated deli meat, establishment of potential thermal processes for inactivating human norovirus and HAV in turkey deli meat would decrease risk and improve public health.
Even though the importance of HNoV in public health is well documented, there is little information on the thermal inactivation characteristics of HNoV and wild-type strains of HAV due to the lack of appropriate cell culture systems. Therefore, viral surrogates have been commonly used based on the assumption that they can mimic the viruses they represent. Two cultivable animal caliciviruses, feline calicivirus (FCV-F9) and murine norovirus (MNV-1), have been extensively used as HNoV surrogates in inactivation studies (15, 16). There are a few strains of HAV (HM-175, HAS-15, and MBB 11/5) that are adaptable to cell culture and used in research for inactivation studies (17, 18).
Knowledge of the thermal inactivation data for a particular microorganism makes it possible to design thermal processes that target specific organisms (9). For this purpose, mathematical modeling has been used with different thermal processes to predict the number of survivors during thermal processing and to give detailed information about inactivation kinetics during treatments (19). The use of a first-order model is more common in the food processing industry (20). However, this model may not always be applicable, and nonlinear behavior may also be observed. Thus, the choice of the most appropriate model is crucial to gather correct information about the thermal inactivation kinetic behavior of the target pathogen. Recent studies conducted on thermal inactivation of HNoV surrogates (21–25) and HAV (26, 27) revealed that the Weibull model was statistically superior to the first-order model in describing the thermal inactivation kinetics of HNoV surrogates and HAV.
To our knowledge, there has been no thermal inactivation kinetics established for inactivation of HNoV surrogates and HAV in turkey deli meat. Therefore, the objectives of this study were (i) to determine the thermal inactivation behavior of HNoV surrogates and HAV in turkey deli meat, (ii) to compare first-order and Weibull models in describing the data in terms of selected statistical parameters, and (iii) to calculate z (thermal resistance) values and activation energy for each model.
MATERIALS AND METHODS
Viruses and cell lines.
Murine norovirus (MNV-1) was obtained from Skip Virgin (Washington University, St. Louis, MO), and the corresponding host RAW 264.7 cells were obtained from the University of Tennessee, Knoxville. Feline calicivirus strain F9 (FCV-F9) and the corresponding host cells (Crandell Reese feline kidney [CRFK] cells) were obtained from ATCC (Manassas, VA). Hepatitis A virus (HAV; strain HM175) and fetal rhesus monkey kidney (FRhK4) cells were kindly provided by Kalmia Kniel (University of Delaware).
As described previously (26), CRFK, RAW 264.7, and FRhK4 cells were maintained in Dulbecco's modified Eagle's medium/Ham's F-12 (DMEM-F12; HyClone Laboratories, Logan, UT) supplemented with 10% heat-inactivated fetal bovine serum (FBS; HyClone Laboratories, Logan, UT) and 1× Anti-Anti (antibiotic-antimycotic; Invitrogen, Grand Island, NY) at 37°C in an atmosphere containing 5% CO2.
Propagation of viruses.
CRFK, RAW 264.7, and FRhK4 cells at ∼90% confluence in cell culture flasks were washed with phosphate-buffered saline (PBS; pH 7.4) twice before FCV-F9, MNV-1, and HAV stocks, respectively, were added to the host cell monolayers. The infected cells were then incubated until >90% cell lysis in a water-jacketed CO2 incubator at 37°C. All three viruses were recovered by centrifugation at 5,000 × g for 10 min, followed by filtration through 0.2-μm-pore-size filters, division into aliquots, and storage at −80°C until use as described before (28).
Inoculation of turkey deli meat.
Turkey deli meat (Sara Lee oven-roasted turkey deli meat) was purchased from a local market and cut into circular pieces (diameter, 3 cm; thickness, 2 mm) prior to virus inoculation. A 100-μl volume of each of the virus stocks (FCV-F9, MNV-1, and HAV), with initial titers of 7.12 ± 0.89 log PFU/ml for FCV-F9, 6.85 ± 1.23 log PFU/ml for MNV-1, and 7.27 ± 1.46 log PFU/ml for HAV, was used to aseptically inoculate the surface of deli meat and allowed to dry at room temperature for 30 min in a biosafety cabinet.
Thermal treatment.
The inoculated turkey deli meat (6 g) was placed into moisture barrier plastic vacuum bags (13 cm by 19 cm) using sterile plastic forceps in a biosafety cabinet. The inoculated samples were vacuum sealed to −100 kPa with a Multivac A300/16 vacuum-packaging unit (Sepp Haggemuller KG, Wolfertschwenden, Germany), and the bags were flattened. To monitor the internal temperature of the sample, a thermocouple was placed at the geometric center of an uninoculated control package of turkey deli meat. The sealed bags were placed into a holding unit and rinsed with 70% ethanol, and then the holding unit with the bags was immersed in a thermostatically controlled (±0.1°C) circulating water bath (model V26; Haake, Karlsruhe, Germany). The water bath temperature was confirmed with a mercury-in-glass (MIG) thermometer (Fisher Scientific, Pittsburgh, PA) and by placing type T thermocouples (Omega Engineering, Inc., Stamford, CT) in the geometric center of the water bath. The thermocouples were connected to a MMS3000-T6V4 portable data recorder (Commtest Instruments, New Zealand) to monitor temperature. Samples were heated at 50°C (for 0, 2, 4, and 6 min), 56 and 60°C (for 0, 1, 2, and 3 min), and 65 and 72°C (for 0, 30 s, 60 s, and 90 s). The treatment time began when the internal temperature reached the designated target temperature. The come-up time (the time required to reach the target temperature) ranged from 21 s to 32 s, depending upon the heating medium temperature. Triplicate bags were used for each time point. After the thermal treatment, sample bags were immediately cooled in an ice water bath for 15 min to stop further thermal inactivation. The bags were rinsed again with ethanol before removal of the contents. Bags were placed in a biosafety cabinet and aseptically cut with scissors that had been sterilized at 121°C for 15 min.
Virus extraction.
The method for virus extraction was performed as described elsewhere (29) with some modifications. Inoculated and thermally treated turkey deli meat was washed with 15 ml of elution buffer (2:5 ratio) containing 0.15 M NaCl and 0.05 M glycine. The pH was then adjusted to 9.0 using 10 M NaOH. Samples in the sterile beaker were then kept shaking on a shaking platform (120 rpm) for 20 min at 4°C. Samples were centrifuged at 10,000 × g for 15 min at 4°C, and the pH of the supernatant was adjusted to 7.2 to 7.4 using 6 N HCl. Polyethylene glycol (PEG) 6000 and NaCl were added to obtain a final concentration of 6% PEG and 0.3 M NaCl. These samples were placed on a shaking platform (120 rpm) overnight at 4°C and then centrifuged at 10,000 × g for 30 min at 4°C. The supernatant was discarded and the pellet dissolved in 2 ml PBS and put on a shaker for 20 min to homogenize. After inoculation of turkey deli meat samples with virus stocks, recovered titers were 6.96 ± 0.62 log PFU/g for FCV-F9, 5.77 ± 0.42 log PFU/g for MNV-1, and 6.86 ± 0.57 log PFU/g for HAV. Extracts containing the individual viruses were stored at −80°C until enumeration of plaques using HAV, MNV-1, and FCV-F9 plaque assays.
Enumeration of survivors by infectious plaque assays.
Thermally treated and control viral suspensions were diluted 1:10 in DMEM-F12 containing fetal bovine serum (10% for MNV-1 and 2% for FCV-F9 and HAV) and 1% antibiotic-antimycotic. The infectivity of each treated virus in comparison to untreated virus controls was evaluated using standardized plaque assays following the previously described procedures (28). Viral survivors were enumerated as PFU per gram.
Modeling of inactivation kinetics.
(i) First-order kinetics.
The traditional approach to describe the change in the number of survivors over time for the first-order kinetic model can be written as follows:
| (1) |
where N(t) is the number of survivors after an exposure time (t) in PFU per gram and the initial population is N0 (in PFU per gram) and k is the first-order rate constant (1/s). This equation is then rearranged into the following equation:
| (2) |
where D is the decimal reduction time (D = 2.303/k [units in minutes or seconds]) and is thus actually a reciprocal first-order rate constant as described previously (30).
(ii) Weibull model.
Experimental data were fitted in decimal logarithmic form as follows:
| (3) |
in which parameter b is defined as follows:
| (4) |
where α (min−1) and β (−) are the scale and shape parameters, respectively.
As indicated by previous studies, the inverse of the scale factor (α) was also used as a reaction rate constant k′ (min) (31).
For the Weibull model, the time required to reduce the number of microorganisms by a factor of 10 (analogous to the D value) can be calculated by using the shape and scale parameters as shown in equation 5:
| (5) |
where D represents decade (or log) reduction of a microbial population. tD has the stated meaning only when it refers to the treatment time starting at zero as described before (26).
The Arrhenius inactivation rate constant and activation energy.
The inactivation rate is primarily influenced by temperature, and the temperature dependence of the rate constant is typically described by the Arrhenius equation:
| (6) |
where k(T) is the reaction rate at temperature T in K, k(Tref) the reaction rate constant at a reference temperature Tref in K, Ea is the activation energy in joules, kilojoules, calories, or kilocalories per mole, R is the universal gas constant (8.314 J mole−1 K−1), and k is the rate constant (1/min). A reference temperature (Tref) of 334.15 K (61°C) was selected in this study because it is in the middle of the temperature range where the survival curves were generated. In the construction of Ln k(T) versus 1/T, the slope of the curve is a straight line which equals Ea/R. This concept has been used to calculate activation energy and the z value of microbial inactivation for the first-order model (32) and the Weibull model (33), respectively.
| (7) |
Lethality for the deli meat thermal process.
Based on the heat penetration time and temperature data for a postpackaging pasteurization process of turkey deli meat (product thickness, 2 mm; package dimensions, 20 mm by 157 mm) given by Pulsfus (34), only the accumulated lethality (F) during the come-up time (tc) was calculated using parameters from each model according to the following equation:
| (8) |
where T corresponds to the temperature, Tref to the specified reference temperature, z to the thermal resistance obtained from each model, and t to the time.
Statistical analysis.
Statistical and nonlinear regression analyses were performed using the SPSS version 11.0.1 statistical package. The statistical criteria applied to discriminate the levels of the goodness of the fit of the models to the experimental data were higher R2 (regression coefficient) and percentage of variance (%V) values, lower chi-square (χ2) values, and lower root mean square error (RMSE) values. For each temperature, the χ2 and RMSE values were predicted by using experimental and predicted survival ratio values for each of the time values as follows:
| (9) |
| (10) |
where Sexp,i was the ith experimentally observed survival ratio, Spred,i was the ith predicted survival ratio, N was the number of observations, and n was the number of constants. Standard errors (SE) were determined for each coefficient.
The percentage of variance (%V) is also accounted for by each model (based on number of terms) as follows:
| (11) |
where R2 is the correlation coefficient, n is the number of data points, and NT is the number of model equation terms. This coefficient takes into account the complexity of the model and the population of data used to describe it. As the number of observations n increases, the number of terms (NT) has less of an effect on the model fitness. The comparison test (analysis of variance [ANOVA], post hoc test) was made to analyze the effects of time on the survival ratio. The confidence level used to determine statistical significance was 95%.
RESULTS AND DISCUSSION
The initial titers of virus stocks were 7.12 ± 0.89 log PFU/ml for FCV-F9, 6.85 ± 1.23 log PFU/ml for MNV-1, and 7.27 ± 1.46 log PFU/ml for HAV. After inoculation of turkey deli meat samples with virus stocks, recovered titers were 6.96 ± 0.62 log PFU/g for FCV-F9, 5.77 ± 0.42 log PFU/g for MNV-1, and 6.86 ± 0.57 log PFU/g for HAV, respectively. The variation in virus titer after inoculation could have been due to losses associated with the virus extraction steps.
In the heating studies performed with inoculated turkey deli meat, samples were heated to selected temperatures (50 to 72°C ± 0.1°C). At 50°C, heating for 6 min resulted in a less than 1 log reduction (PFU/g) for all viral surrogates (Fig. 1). At the highest temperatures used (65 and 72°C), total inactivation was achieved in less than 30 s only for the HNoV surrogates (FCV-F9 and MNV-1) and not for HAV. In order to understand the mechanism of viral inactivation during thermal treatment, thermodynamic analysis could be helpful (35). Since virus capsid assembly is a critical step in the viral life cycle, the stability of the capsid can be analyzed by investigating protein-protein and protein-nucleic acid interactions. Under physiological conditions, the protein-protein interactions are very weak, and interactions between protein and nucleic acid are relatively strong. Based on these interactions, it was assumed that there are two states of virus present in different environments, one with a low tendency to disassembly and the other with a high tendency to disassembly (35). Since the various components of the virus, such as capsids and nucleic acids, have widely different values of entropy and enthalpy of state among different viruses, the degradation or inactivation rates of viruses would be expected to be different (36).
FIG 1.
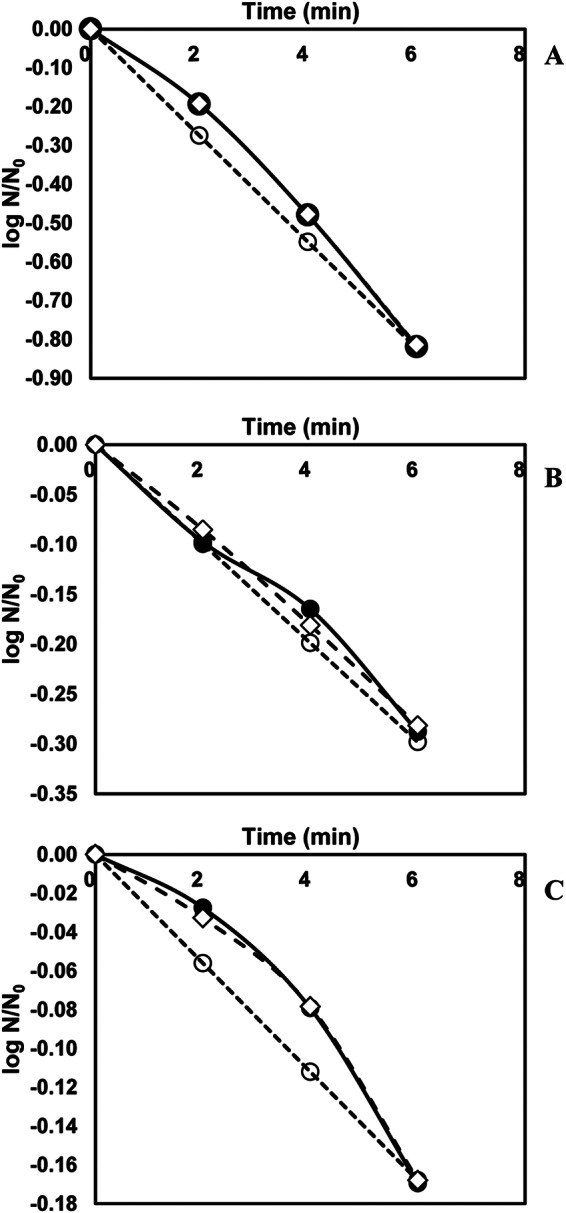
Survival curves of human norovirus surrogates and hepatitis A virus in turkey deli meat at 50°C. (A) FCV-F9; (B) MNV-1; (C) HAV. Solid lines with filled circles, experimental; dashed lines with open circles, first-order model; dashed lines with open diamonds, Weibull model.
The D values calculated from the first-order model (50 to 72°C) were in the range of 9.9 ± 3.9 to 0.1 ± 0.0 min for FCV-F9, 21.0 ± 0.8 to 0.22 ± 0.0 min for MNV-1, and 42.0 ± 5.6 to 1.0 ± 0.1 min for HAV (Table 1). For each virus, the temperature had a significant effect on D values in the studied temperature range (P < 0.05). In general, HAV was more resistant to thermal treatment than FCV-F9 and MNV-1 at all the studied temperatures, suggesting that it would require a more severe treatment than the HNoV surrogates for inactivation in turkey deli meat. In addition to FCV-F9 and MNV-1, other HNoV surrogates, including Tulane virus (TV) and poliovirus (PV), reportedly showed lower stability than HAV during thermal treatment (37, 38). The efficacies of heat against enteric viruses and viral surrogates in different foods would be expected to differ, since food components are known to influence the thermal inactivation of viruses. In order to evaluate the effects of food matrix composition on thermal inactivation, the levels of resistance of HAV were compared in several food samples. Thermal inactivation studies for HAV have involved cell culture medium, spinach, shellfish, mussels, clams, cockles, and milk; reported D values for HAV in the range of 50 to 100°C were 0.01 to 385 min (26, 27, 39–50). According to the product description, the composition of the turkey deli meat included sodium (10 mg/g), fat (0.8%), carbohydrates (1.7%), protein (19%), and moisture (77%). In general, the thermal inactivation of HAV in turkey deli meat was considerably higher than in spinach and similar to that in cell culture media and seafood (26, 27, 50). The presence of higher levels of protein in the food matrix may protect enteric viruses from the action of heat, whereas the higher water concentration in spinach may increase their sensitivity to thermal treatment (51).
TABLE 1.
Coefficients of the first-order and Weibull models for the survival curves of feline calicivirus strain F9, murine norovirus 1, and hepatitis A virus in turkey deli meat during thermal inactivation
| Virus straina | T (°C) | Weibull distribution |
First-order kinetics |
||||
|---|---|---|---|---|---|---|---|
| β | α (min) | tD = 1 (min) | R2 | D (min) | R2 | ||
| FCV-F9 | 50 | 0.85 ± 0.46 | 3.8 ± 0.5 | 11.9 ± 5.1 | 0.99 | 9.9 ± 3.9 | 0.94 |
| 56 | 0.59 ± 0.11 | 0.7 ± 0.2 | 3.0 ± 0.3 | 0.99 | 3.0 ± 0.2 | 0.94 | |
| 60 | 0.90 ± 0.27 | 0.3 ± 0.1 | 0.8 ± 0.1 | 0.99 | 0.8 ± 0.1 | 0.96 | |
| 65 | 1.80 ± 0.98 | 0.3 ± 0.2 | 0.5 ± 0.2 | 0.97 | 0.4 ± 0.1 | 0.89 | |
| 72 | 0.33 ± 0.01 | 0.1 ± 0.0 | 0.1 ± 0.0 | 0.99 | 0.1 ± 0.0 | 0.90 | |
| MNV-1 | 50 | 1.16 ± 0.10 | 8.6 ± 0.4 | 17.8 ± 1.8 | 0.98 | 21.0 ± 0.8 | 0.97 |
| 56 | 1.11 ± 0.14 | 3.1 ± 0.3 | 6.7 ± 0.6 | 0.99 | 7.3 ± 0.8 | 0.99 | |
| 60 | 1.03 ± 0.41 | 1.1 ± 0.2 | 2.8 ± 0.5 | 0.99 | 2.7 ± 0.6 | 0.98 | |
| 65 | 1.72 ± 0.15 | 0.5 ± 0.1 | 0.9 ± 0.1 | 0.96 | 0.9 ± 0.1 | 0.94 | |
| 72 | 1.67 ± 1.00 | 0.2 ± 0.1 | 0.3 ± 0.1 | 0.99 | 0.2 ± 0.0 | 0.96 | |
| HAV | 50 | 1.64 ± 0.20 | 11.8 ± 2.2 | 25.9 ± 3.7 | 0.99 | 42.0 ± 5.6 | 0.97 |
| 56 | 1.23 ± 0.01 | 7.2 ± 0.7 | 7.0 ± 0.7 | 0.99 | 20.6 ± 2.5 | 0.96 | |
| 60 | 0.68 ± 0.09 | 2.7 ± 0.4 | 1.7 ± 0.2 | 0.99 | 5.9 ± 1.3 | 0.94 | |
| 65 | 1.24 ± 0.10 | 0.8 ± 0.3 | 0.6 ± 0.3 | 0.99 | 2.3 ± 0.4 | 0.95 | |
| 72 | 1.71 ± 0.26 | 0.5 ± 0.3 | 0.6 ± 0.3 | 0.99 | 1.0 ± 0.1 | 0.93 | |
FCV-F9, feline calicivirus strain F9; MNV-1, murine norovirus 1; HAV, hepatitis A virus.
The shape and scale factor parameters were also calculated for the Weibull model (Table 1). The Weibull shape factor (β [dimensionless]) and scale factor (α [in minutes]) ranges for the temperature range studied (50 to 72°C) were 1.80 ± 0.98 to 0.33 ± 0.0 and 3.8 ± 0.5 to 0.1 ± 0.0 min for FCV-F9, 1.72 ± 0.15 to 1.03 ± 0.41 and 17.8 ± 1.8 to 0.3 ± 0.1 min for MNV-1, and 1.71 ± 0.26 to 0.68 ± 0.09 and 11.8 ± 2.2 to 0.5 ± 0.3 min for HAV, respectively. A shape factor value of more than 1 (concave and oriented downward, or a shoulder effect) indicates that the remaining population becomes increasingly damaged, whereas a shape factor of less than 1 (concave and oriented upward, or a tailing effect) indicates that the remaining population has the ability to adapt to applied stress (52). In his review paper, van Boekel (52) evaluated data from 55 different studies of thermal inactivation of vegetative bacterial cells, and he reported that the shape factor was independent of temperature in 48 of those studies. Moreover, Cunha et al. (53) reported that the shape factor was independent of external factors because the parameter was a behavior index which represented the resistance mechanism of the organism. Consistent with Cunha et al. (53), the results of this study revealed that for each virus strain, the temperature apparently did not influence the shape parameter, which could not be described by any model. In contrast to the shape factor, the scale parameter depends on the temperature, and a change in the scale factor reflects the effect of heat on inactivation. The results in the present study showed that temperature had a significant effect on the scale factor (α) values (P < 0.05). Since the shape parameter (β) was independent of heating temperature, in order to evaluate the temperature dependence of the b parameter [b = 1/2.303 × (1/α)β], a constant β value (achieved by fixing β at its average) was used for each virus strain, as suggested in references 33, 54, and 55 (Fig. 2). The average β values were 0.84, 1.31, and 1.23 for FCV-F9, MNV-1, and HAV, respectively. A power-law model was established to quantify the influence of temperature on the scale value for each virus strain (Fig. 2). For each virus strain, by the use of average β values, the application of the power-law relationship allowed prediction of inactivation behavior at any of the other temperatures (<50°C and >72°C). It could also be concluded that, within the temperature range studied, HAV was less sensitive to temperature change than FCV-F9 and MNV-1 (Fig. 2). The relationships between b values and temperature for FCV-F9, MNV-1, and HAV were expressed by a power-law model in equations 12, 13, and 14, respectively, as follows:
| (12) |
| (13) |
| (14) |
FIG 2.
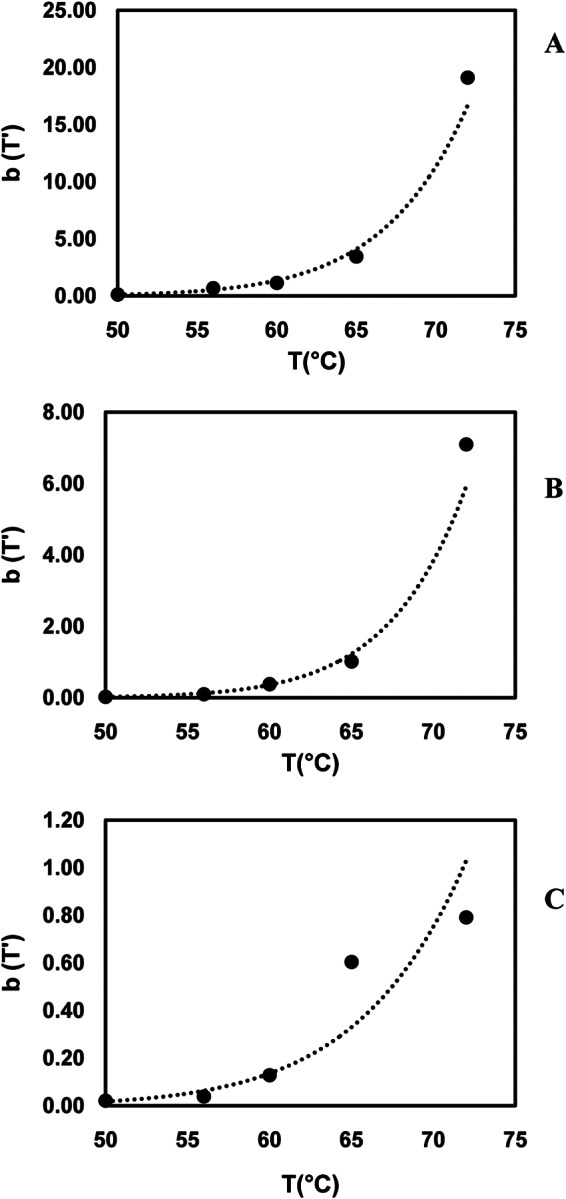
The fit of the power-law model to Weibull model parameter b as a function of temperature for the constant n. (A) FCV-F9 at n = 0.89 (R2 = 0.99); (B) MNV-1 at n = 1.31 (R2 = 0.99); (C) HAV at n = 1.23 (R2 = 0.96).
Parameters of the Weibull model (shape factor = β and scale factor = α) were also used to calculate the tD value, which was used as an analog to the D value of the first-order model, where it refers to the treatment time starting at zero (Table 1). For the Weibull model, the calculated durations of time required to destroy 1 log (D = 1) for FCV-F9, MNV-1, and HAV were in the range of 11.9 ± 5.1 to 0.1 ± 0.0 min, 17.8 ± 1.8 to 0.3 ± 0.1 min, and 25.9 ± 3.7 to 0.6 ± 0.3 min, respectively, for the temperature range of 50 to 72°C (Table 1).
The temperature dependency of the inactivation rate constant ratio (k/kref and k′/kref) was fitted by the log-logistic relationship for both models (Fig. 3) as suggested by Peleg et al. (56). Even though the inactivation rate constant ratio values increased with increasing temperature for both models, the increase was not proportional to the temperature change. This also implies that the inactivation of the viruses shows nonlinear inactivation behavior for each of the virus surrogates. For the first-order model, the inactivation rate constant (k/kref) ratios were in the range of 0.2 to 16 min−1 for FCV, 0.1 to 10.4 min−1 for MNV-1, and 0.1 to 2.3 min−1 for HAV, whereas, for k′/kref, they were in the range of 0.2 to 19 min−1, 0.1 to 8 min−1, and 0.1 to 1.6 min−1 for FCV-F9, MNV-1, and HAV, respectively. Even though all viral surrogates had similar inactivation rate constants at 50°C, the inactivation rate constants were significantly different at 72°C (P < 0.05). At 72°C, FCV-F9 had the highest inactivation rate constant ratio whereas HAV had the lowest (P < 0.05). Since a higher inactivation rate constant indicates a greater sensitivity to temperature increases, FCV-F9 showed the highest sensitivity to temperature increases whereas HAV showed the lowest sensitivity (Fig. 3). A typical inactivation rate constant for vegetative cells might range up to 1010 min−1, while inactivation rate constants for bacterial spores are 0.5 to 5 min−1 (57). Based on the inactivation rate constant value for vegetative cells and bacterial spores, the thermal resistance of FCV-F9, MNV-1, and HAV was much higher than that of vegetative cells at 50, 56, and 65°C, respectively. However, at higher temperatures (>50°C for FCV-F9, >56°C for MNV-1, and >65°C for HAV), their thermal resistance was similar to that of the bacterial spores (Fig. 3).
FIG 3.

The fit of the log-logistic model to inactivation rate constants for each model as a function of temperature. (A) FCV-F9, first-order model (R2 = 0.97); (B) FCV-F9, Weibull model (R2 = 0.98); (C) MNV-1, first-order model (R2 = 0.98); (D) MNV-1, Weibull model (R2 = 0.99); (E) HAV, first-order model (R2 = 0.96); (F) HAV-Weibull model (R2 = 0.97).
Activation energy is the measure of the temperature sensitivity of the microorganism under various conditions (58). Typical activation energy values for bacterial spores range from 250 to 335 kJ/mole, whereas they range from 210 to 625 kJ/mole for vegetative cells (59). A high activation energy value means that small increases in temperature can have significantly greater effects on thermal death. The estimated activation energies for the first-order model were 181 ± 16, 196 ± 5, and 167 ± 9 kJ/mole virion for FCV-F9, MNV-1, and HAV, respectively. For the Weibull model, estimated activation energies for FCV-F9, MNV-1, and HAV were 214 ± 28, 242 ± 36, and 154 ± 159 kJ/mole virion, respectively (Table 2). Bozkurt et al. (26) reported that the respective activation energies for FCV-F9, MNV-1, and HAV in cell culture media (DMEM containing 10% fetal bovine serum and 1% antibiotic-antimycotic) were 225, 278, and 182 kJ/mole virion for the Weibull model and 195, 202, and 171 kJ/mole virion for the first-order model. In agreement with the present results for FCV-F9, MNV-1, and HAV, the reported activation energies for both studies were not statistically different for either model (P > 0.05). The activation energy values obtained for HAV from the first-order model (154 kJ/mole virion) and Weibull model (173 kJ/mole virion) were lower than the activation energy values for spores and vegetative cells. Also, for both models, the activation energy value for HAV was lower than that of the HNoV surrogates (Table 2). Thus, it would be prudent to design thermal processes for foods based on the data for HAV when there is a potential for contamination by the virus.
TABLE 2.
The activation energies of the first-order and Weibull models for feline calicivirus strain F9, murine norovirus 1, and hepatitis A virus
| Virus straina | Weibull distribution |
First-order kinetics |
||
|---|---|---|---|---|
| Ea (kJ/mole virion) | R2 | Ea (kJ/mole virion) | R2 | |
| FCV-F9 | 214 ± 28 | 0.97 | 181 ± 16 | 0.98 |
| MNV-1 | 242 ± 36 | 0.96 | 196 ± 5 | 0.99 |
| HAV | 154 ± 19 | 0.96 | 167 ± 9 | 0.97 |
FCV-F9, feline calicivirus strain F9; MNV-1, murine norovirus 1; HAV, hepatitis A virus.
In addition to activation energies for both models, the z values for inactivation of HNoV surrogates and HAV were calculated (Table 3). The results revealed that there were no significant differences observed between the z values for FCV-F9, MNV-1, and HAV in turkey deli meat (P > 0.05). Bozkurt et al. (26) determined the z values for FCV-F9, MNV-1, and HAV in cell culture media (DMEM containing 10% fetal bovine serum and 1% antibiotic-antimycotic) to be 9.66 ± 0.94°C, 9.16 ± 1.12°C, and 14.50 ± 2.93°C for the Weibull model and 9.36 ± 0.62°C, 9.32 ± 0.47°C, and 12.49 ± 0.20°C for the first-order model, respectively. Unlike D values, the z value is not a function of the heating environment. Therefore, z values should be the same or similar for a specific microorganism in different food matrices. In terms of the z values determined for FCV-F9, MNV-1, and HAV, there were no significant differences between those observed in the present study and those reported by Bozkurt et al. (26). It should also be noted that the z value for the nth decimal reduction has the same value. We can conclude that the concepts of decimal reduction time and z value, when carefully defined, are useful with the Weibull model. However, care must be taken in comparing such z values with those derived from a constant parameter linear model.
TABLE 3.
The z values of the first-order and Weibull models for feline calicivirus strain F9, murine norovirus 1, and hepatitis A virus
| Virus straina | Weibull distribution |
First-order kinetics |
||
|---|---|---|---|---|
| z value (°C) | R2 | z value (°C) | R2 | |
| FCV-F9 | 11.3 ± 2.1 | 0.99 | 11.9 ± 1.0 | 0.98 |
| MNV-1 | 11.0 ± 1.6 | 0.99 | 10.9 ± 1.3 | 0.99 |
| HAV | 13.4 ± 2.6 | 0.98 | 12.8 ± 0.7 | 0.97 |
FCV-F9, feline calicivirus strain F9; MNV-1, murine norovirus 1; HAV, hepatitis A virus.
Koopmans and Duizer (60) classified the risks of infection for the consumer when viruses are present before processing. The risks were classified into four grades as negligible risk, low risk, medium risk, and high risk. According to this classification and as reported before (26), any treatment that would result in at least a 4 log reduction of virus levels would represent a negligible risk of infection. Thus, a process achieving a 6 log reduction (often used as a criterion for pasteurization) could be considered a safe food process. For the first-order model, the extent of inactivation is determined by simple multiplication of D, while with the Weibull model, this cannot be computed from tD (both α and β are needed). This means that D values are determined from the linear part of the overall survivor curve, whereas the tD value takes into account everything that happens up to reaching the survival decimal reduction point (19). It should also be noted that, as with the log linear approach, where 6 D is equal to 6 * D, tD is not 6 * tD = 1 but tD = 6. Based on the thermal inactivation data obtained from this study, for both models (the first-order model and the Weibull model), the processing times required to achieve a 6 log reduction at temperatures 80, 85, 90, 95, and 100°C were calculated (Table 4).
TABLE 4.
Estimated process time to achieve 6 log reduction for the first-order and Weibull models of feline calicivirus strain F9, murine norovirus 1, and hepatitis A virus in turkey deli meat during thermal inactivation
| Model | Virus straina | Time (s) to achieve 6-log reduction of virus numbers at temp (°C): |
||||
|---|---|---|---|---|---|---|
| 80 | 85 | 90 | 95 | 100 | ||
| First order | FCV-F9 | 12 | 5 | 2 | 1 | 1 |
| MNV-1 | 15 | 6 | 2 | 1 | 1 | |
| HAV | 107 | 46 | 20 | 9 | 4 | |
| Weibull | FCV-F9 | 6 | 3 | 1 | 1 | 1 |
| MNV-1 | 10 | 4 | 2 | 1 | 1 | |
| HAV | 65 | 34 | 18 | 10 | 5 | |
FCV-F9, feline calicivirus strain F9; MNV-1, murine norovirus 1; HAV, hepatitis A virus.
The thermal inactivation behavior of the human norovirus surrogates (FCV-F9 and MNV-1) and hepatitis A virus had a good fitness with the Weibull model and had higher regression coefficients and percentage of variance (%V) values and lower RMSE and χ2 values rather than with the first-order model (Table 5). Based on the selected statistical criteria (R2, %V, RMSE, and χ2), the present results revealed that the Weibull model could be successfully used to describe thermal inactivation of all virus surrogates in turkey deli meat (Table 5). It should be noted that accurate model prediction of survival curves would be beneficial to the food industry in selecting the optimum combinations of temperature and time to obtain the desired levels of inactivation. For processes at higher temperatures (80 to 90°C), employing first-order predictions would lead to unnecessary overprocessing (Table 4). Using a log-linear model for a nonlinear survival curve could influence sensory and nutritional aspects of the food as well as energy use (61).
TABLE 5.
Comparison of the first-order and Weibull models for the survival curves of feline calicivirus strain F9, murine norovirus 1, and hepatitis A virusa
| Virus strain | T(°C) | Weibull model |
First-order model |
||||
|---|---|---|---|---|---|---|---|
| %V | RMSE | χ2 | %V | RMSE | χ2 | ||
| FCV-F9 | 50 | 97 | 0.003 | 0.0001 | 91 | 0.053 | 0.004 |
| 56 | 97 | 0.043 | 0.002 | 91 | 0.138 | 0.026 | |
| 60 | 97 | 0.022 | 0.001 | 94 | 0.088 | 0.010 | |
| 65 | 91 | 0.037 | 0.001 | 84 | 0.369 | 0.182 | |
| 72 | 97 | 0.036 | 0.002 | 85 | 0.369 | 0.18 | |
| MNV-1 | 50 | 96 | 0.011 | 0.0002 | 94 | 0.018 | 0.0004 |
| 56 | 99 | 0.001 | 0.0001 | 97 | 0.022 | 0.0006 | |
| 60 | 97 | 0.008 | 0.0001 | 97 | 0.022 | 0.0007 | |
| 65 | 91 | 0.021 | 0.0006 | 88 | 0.114 | 0.0172 | |
| 72 | 94 | 0.090 | 0.107 | 97 | 0.127 | 0.0898 | |
| HAV | 50 | 97 | 0.003 | 0.0001 | 95 | 0.022 | 0.001 |
| 56 | 97 | 0.002 | 0.0001 | 94 | 0.006 | 0.001 | |
| 60 | 97 | 0.014 | 0.0001 | 91 | 0.034 | 0.002 | |
| 65 | 97 | 0.013 | 0.0001 | 92 | 0.029 | 0.001 | |
| 72 | 97 | 0.051 | 0.0001 | 89 | 0.128 | 0.022 | |
FCV-F9, feline calicivirus strain F9; MNV-1, murine norovirus 1; HAV, hepatitis A virus; %V, percentage of variance; RMSE, root mean square error; χ2, chi square.
It should be noted that these calculated process conditions are valid only when the product reaches the desired temperature; therefore, the contribution of the come-up time (the time to reach the desired temperature) needs to be considered in order to determine precise thermal process conditions. Based on heat penetration data for a postpackaging process of pasteurization of turkey deli meat (product thickness, 2 mm; package dimensions, 20 mm by 157 mm) at a process temperature of 90.6°C, the reported come-up time (tc) would be 8 min using hot water and the internal product temperature reached would be 76.9°C (34). Using the thermal inactivation data obtained from the present study and a Tref of 76.9°C, the process lethality values for HAV during the come-up time would be 0.99 and 1.08 min, equivalent to 2.04 and 2.56 log reductions using the first-order model and the Weibull model, respectively. In contrast, using Listeria monocytogenes, which is the most common target pathogen for the deli meat industry, under the same conditions (34), the process lethality during the come-up time would be 0.71 min, producing an estimated 38 log reduction based on the calculated D76.9°C value (D76.9°C = 0.002 s) derived from the reported D (D70°C = 0.27 min) and z (z = 5.98°C) values for L. monocytogenes (62, 63). Thus, when L. monocytogenes is used as a target pathogen to determine thermal process conditions in the deli meat industry, viable HAV may remain, constituting a potential health risk for consumers. Therefore, regulatory authorities may have to reconsider the basis for choosing thermal process conditions in order to reduce the risk of viral foodborne illness outbreaks.
Conclusion.
The thermal inactivation data obtained from this study showed that HNoV surrogates and HAV are apparently more heat resistant than many vegetative bacterial foodborne pathogens, including L. monocytogenes. Thus, processing recommendations based on data for vegetative bacterial pathogens may not eliminate similar numbers of foodborne enteric viruses. Therefore, there is a definite need to rethink the choice of target pathogen used while determining guidelines for thermal processes. Since the Weibull model described the thermal inactivation behavior of HAV better than the first-order model, the application of the thermal process based on the data generated with the use of the Weibull model will be beneficial to the food industry in selecting optimum process conditions to obtain the desired level of inactivation. The results of this study will be useful to the food industry in designing pasteurization conditions for turkey deli meat to inactivate or control HAV and/or HNoV surrogates.
ACKNOWLEDGMENTS
We gratefully acknowledge the funding for this research that was provided by Agriculture and Food Research Initiative grant no. 2011-68003-20096 from the USDA National Institute of Food and Agriculture, Food Safety-A4121.
REFERENCES
- 1.Scallan E, Hoekstra RM, Mahon BE, Jones TF, Griffin PM. 30 January 2015, posting date. An assessment of the human health impact of seven leading foodborne pathogens in the United States using disability adjusted life years. Epidemiol Infect doi: 10.1017/S0950268814003185. [DOI] [PMC free article] [PubMed] [Google Scholar]
- 2.Hall AJ, Wikswo ME, Pringle K, Gould LH, Parashar UD. 2014. Vital signs: foodborne norovirus outbreaks—United States, 2009–2012. MMWR Morb Mortal Wkly Rep 63:491–495. [PMC free article] [PubMed] [Google Scholar]
- 3.Hall AJ, Wikswo ME, Manikonda K, Roberts VA, Yoder JS, Gould LH. 2013. Acute gastroenteritis surveillance through the National Outbreak Reporting System, United States. Emerg Infect Dis 19:1305–1309. doi: 10.3201/eid1908.130482. [DOI] [PMC free article] [PubMed] [Google Scholar]
- 4.Scallan E, Hoekstra RM, Angulo FJ, Tauxe RV, Widdowson MA, Roy SL, Jones JL, Griffin PM. 2011. Foodborne illness acquired in the United States—major pathogens. Emerg Infect Dis 17:7–15. doi: 10.3201/eid1701.P11101. [DOI] [PMC free article] [PubMed] [Google Scholar]
- 5.USDA Food Safety and Inspection Service (FSIS). 2003. Quantitative assessment of relative risk to public health from foodborne Listeria monocytogenes among selected categories of ready-to-eat foods. Center for Food Safety and Applied Nutrition, Food and Drug Administration, US Department of Health and Human Services, Food Safety Inspection Service, US Department of Agriculture, Washington, DC. [Google Scholar]
- 6.Gould LH, Walsh KA, Vieira AR, Herman K, Willimas IT, Hall AJ, Cole D. 2013. Surveillance for foodborne disease outbreaks—United States, 1998–2008. MMWR Surveill Summ 62:1–34. [PubMed] [Google Scholar]
- 7.Painter JA, Hoekstra RM, Ayers T, Tauxe RV, Braden CR, Angulo FJ, Griffin PM. 2013. Attribution of foodborne illnesses, hospitalizations, and deaths to food commodities by using outbreak data, United States, 1998–2008. Emerg Infect Dis 19:407–415. doi: 10.3201/eid1903.111866. [DOI] [PMC free article] [PubMed] [Google Scholar]
- 8.Murphy RY, Osaili T, Duncan LK, Marcy JA. 2004. Thermal inactivation of Salmonella and Listeria monocytogenes in ground chicken thigh/leg meat and skin. Poult Sci 83:1218–1225. doi: 10.1093/ps/83.7.1218. [DOI] [PubMed] [Google Scholar]
- 9.Houben JH, Eckenhausen F. 2006. Surface pasteurization of vacuum-sealed precooked ready-to-eat meat products. J Food Prot 69:459–468. [DOI] [PubMed] [Google Scholar]
- 10.Jaykus L. 2000. Enteric viruses as ‘emerging agents' of foodborne disease. Irish J Agr Food Res 39:245–255. [Google Scholar]
- 11.Bryan FL. 1995. Hazard analysis: the link between epidemiology and microbiology. J Food Prot 59:102–107. [DOI] [PubMed] [Google Scholar]
- 12.Restaino L, Wind CE. 1990. Antimicrobial effectiveness of hand washing for food establishments. Dairy Food Environ San 10:136–141. [Google Scholar]
- 13.Mangalassary S. 2012. In-package pasteurization of ready to eat (RTE) meat products—an effective way to control post-processing contamination. J Food Process Technol 3:e110. [Google Scholar]
- 14.Sair AI, D'Souza DH, Jaykus AL. 2002. Human enteric viruses as causes of foodborne disease. Compr Rev Food Sci Food Saf 1:73–89. doi: 10.1111/j.1541-4337.2002.tb00008.x. [DOI] [PubMed] [Google Scholar]
- 15.Hewitt J, Greening G. 2004. Survival and persistence of norovirus, hepatitis A virus, and feline calicivirus in marinated mussels. J Food Prot 67:1743–1750. [DOI] [PubMed] [Google Scholar]
- 16.Richards GP. 2012. Critical review of norovirus surrogates in food safety research: rationale for considering volunteer studies. Food Environ Virol 4:6–13. doi: 10.1007/s12560-011-9072-7. [DOI] [PMC free article] [PubMed] [Google Scholar]
- 17.Martin A, Lemon SM. 2006. Hepatitis A virus: from discovery to vaccines. Hepatology 43:S164–S172. doi: 10.1002/hep.21052. [DOI] [PubMed] [Google Scholar]
- 18.Reiner P, Reinerova M, Veselovska Z. 1992. Comparison of two defective hepatitis A virus strains adapted to cell cultures. Acta Virol 36:245–252. [PubMed] [Google Scholar]
- 19.Peleg M, Cole B. 1998. Reinterpretation of microbial survival curves. Crit Rev Food Sci Nutr 38:353–380. doi: 10.1080/10408699891274246. [DOI] [PubMed] [Google Scholar]
- 20.Peleg M. 1999. On calculating sterility in thermal and non-thermal preservation methods. Food Res Int 32:271–278. doi: 10.1016/S0963-9969(99)00081-2. [DOI] [Google Scholar]
- 21.Seo K, Lee JE, Lim MY, Ko G. 2012. Effect of temperature, pH, and NaCl on the inactivation kinetics of murine norovirus. J Food Prot 75:533–540. doi: 10.4315/0362-028X.JFP-11-199. [DOI] [PubMed] [Google Scholar]
- 22.Tuladhar E, Bouwknegt M, Zwietering MH, Koopmans M, Duizer E. 2012. Thermal stability of structurally different viruses with proven or potential relevance to food safety. J Appl Microbiol 112:1050–1057. doi: 10.1111/j.1365-2672.2012.05282.x. [DOI] [PMC free article] [PubMed] [Google Scholar]
- 23.Bozkurt H, D'Souza DH, Davidson PM. 2013. Determination of the thermal inactivation kinetics of the human norovirus surrogates, murine norovirus, and feline calicivirus. J Food Prot 76:79–84. doi: 10.4315/0362-028X.JFP-12-327. [DOI] [PubMed] [Google Scholar]
- 24.Bozkurt H, D'Souza DH, Davidson PM. 2014. Thermal inactivation of human norovirus surrogates in spinach and measurement of its uncertainty. J Food Prot 77:276–283. doi: 10.4315/0362-028X.JFP-13-289. [DOI] [PubMed] [Google Scholar]
- 25.Bozkurt H, Leiser S, Davidson PM, D'Souza DH. 2014. Thermal inactivation kinetic modeling of human norovirus surrogates in blue mussel (Mytilus edulis) homogenate. Int J Food Microbiol 172:130–136. doi: 10.1016/j.ijfoodmicro.2013.11.026. [DOI] [PubMed] [Google Scholar]
- 26.Bozkurt H, D'Souza DH, Davidson PM. 2014. A comparison of the thermal inactivation kinetics of human norovirus surrogates and hepatitis A virus in buffered cell culture medium. Food Microbiol 42:212–217. doi: 10.1016/j.fm.2014.04.002. [DOI] [PubMed] [Google Scholar]
- 27.Bozkurt H, D'Souza DH, Davidson PM. 2014. Determination of thermal inactivation kinetics of hepatitis A virus in blue mussel (Mytilus edulis) homogenate. Appl Environ Microbiol 80:3191–3197. doi: 10.1128/AEM.00428-14. [DOI] [PMC free article] [PubMed] [Google Scholar]
- 28.Su X, Howell AB, D'Souza DH. 2010. The effect of cranberry juice and cranberry proanthocyanidins on the infectivity of human enteric viral surrogates. Food Microbiol 27:535–540. doi: 10.1016/j.fm.2010.01.001. [DOI] [PubMed] [Google Scholar]
- 29.Baert L, Uyttendaele M, Debevere J. 2007. Evaluation of two viral extraction methods for the detection of human noroviruses in shellfish with conventional and real-time reverse transcriptase PCR. Lett Appl Microbiol 44:106–111. doi: 10.1111/j.1472-765X.2006.02047.x. [DOI] [PubMed] [Google Scholar]
- 30.Bigelow WD. 1921. The logarithmic nature of thermal death time curves. J Infect Dis 29:528–536. doi: 10.1093/infdis/29.5.528. [DOI] [Google Scholar]
- 31.Fernández A, Collado J, Cunha LM, Ocio MJ, Martinez A. 2002. Empirical model building based on Weibull distribution to describe the joint effect of pH and temperature on the thermal resistance of Bacillus cereus in vegetable substrate. Int J Food Microbiol 77:147–153. doi: 10.1016/S0168-1605(02)00046-6. [DOI] [PubMed] [Google Scholar]
- 32.Corradini MG, Normand MD, Peleg M. 2005. Calculating the efficacy of heat sterilization processes. J Food Eng 67:59–69. doi: 10.1016/j.jfoodeng.2004.08.001. [DOI] [Google Scholar]
- 33.Mafart P, Couvert O, Gaillard S, Leguerinel I. 2002. On calculating sterility in thermal preservation methods: application of the Weibull frequency distribution model. Int J Food Microbiol 72:107–113. doi: 10.1016/S0168-1605(01)00624-9. [DOI] [PubMed] [Google Scholar]
- 34.Pulsfus S. 2006. Post-packaging pasteurization of RTE meat products. In Knipe LC. (ed), Thermal processing of RTE meat products. Ohio State University, Columbus, OH. [Google Scholar]
- 35.Katen S, Zlotnick A. 2009. The thermodynamics of virus capsid assembly. Methods Enzymol 455:395–417. doi: 10.1016/S0076-6879(08)04214-6. [DOI] [PMC free article] [PubMed] [Google Scholar]
- 36.Pollard EC. 1960. Theory of the physical means of the inactivation of viruses. Ann N Y Acad Sci 83:654–660. [Google Scholar]
- 37.Strazynski M, Kramer J, Becker B. 2002. Thermal inactivation of poliovirus type 1 in water, milk and yoghurt. Int J Food Microbiol 74:73–78. doi: 10.1016/S0168-1605(01)00708-5. [DOI] [PubMed] [Google Scholar]
- 38.Hirneisen KA, Kniel KE. 2013. Comparing human norovirus surrogates: murine norovirus and Tulane virus. J Food Prot 76:139–143. doi: 10.4315/0362-028X.JFP-12-216. [DOI] [PubMed] [Google Scholar]
- 39.Parry JV, Mortimer PP. 1984. The heat sensitivity of hepatitis A virus determined by a simple tissue culture method. J Med Virol 14:277–283. doi: 10.1002/jmv.1890140312. [DOI] [PubMed] [Google Scholar]
- 40.Millard J, Appleton H, Parry JV. 1987. Studies on heat inactivation of hepatitis A virus with special reference to shellfish. Part 1. Procedures for infection and recovery of virus from laboratory-maintained cockles. Epidemiol Infect 98:397–414. [DOI] [PMC free article] [PubMed] [Google Scholar]
- 41.Croci L, Ciccozzi M, De Medici D, Di Pasquale S, Fiore A, Mele A, Toti L. 1999. Inactivation of hepatitis A virus in heat-treated mussels. J Appl Microbiol 87:884–888. doi: 10.1046/j.1365-2672.1999.00935.x. [DOI] [PubMed] [Google Scholar]
- 42.Croci L, De Medici D, Di Pasquale S, Toti L. 2005. Resistance of hepatitis A virus in mussels subjected to different domestic cookings. Int J Food Microbiol 105:139–144. doi: 10.1016/j.ijfoodmicro.2005.04.008. [DOI] [PubMed] [Google Scholar]
- 43.Bidawid S, Farber JM, Sattar SA. 2000. Inactivation of hepatitis A virus (HAV) in fruits and vegetables by gamma irradiation. Int J Food Microbiol 57:91–97. doi: 10.1016/S0168-1605(00)00235-X. [DOI] [Google Scholar]
- 44.Mariam TW, Cliver DO. 2000. Small round coliphages as surrogates for human viruses in process assessment. Dairy Food Environ Sanit 20:684–689. [Google Scholar]
- 45.Hewitt J, Greening GE. 2006. Effect of heat treatment on hepatitis A virus and norovirus in New Zealand greenshell mussels (Perna canaliculus) by quantitative real-time reverse transcription PCR and cell culture. J Food Prot 69:2217–2223. [DOI] [PubMed] [Google Scholar]
- 46.Hewitt J, Rivera-Aban M, Greening GE. 2009. Evaluation of murine norovirus as a surrogate for human norovirus and hepatitis A virus in heat inactivation studies. J Appl Microbiol 107:65–71. doi: 10.1111/j.1365-2672.2009.04179.x. [DOI] [PMC free article] [PubMed] [Google Scholar]
- 47.Gibson KE, Schwab KJ. 2011. Thermal inactivation of human norovirus surrogates. Food Environ Virol 3:74–77. doi: 10.1007/s12560-011-9059-4. [DOI] [Google Scholar]
- 48.Sow H, Desbiens M, Morales-Rayas R, Ngazoa SE, Jean J. 2011. Heat inactivation of hepatitis A virus and a norovirus surrogate in soft-shell clams (Mya arenaria). Foodborne Pathog Dis 8:387–393. doi: 10.1089/fpd.2010.0681. [DOI] [PubMed] [Google Scholar]
- 49.Cappellozza E, Arcangeli G, Rosteghin M, Kapllan S, Magnabosco C, Bertoli E, Terregino C. 2012. Survival of hepatitis A virus in pasteurized Manila clams. Ital J Food Sci 24:247–253. [Google Scholar]
- 50.Bozkurt H, D'Souza DH, Davidson PM. 2015. Determination of thermal inactivation kinetics of hepatitis A virus in spinach. Int J Food Microbiol 193:147–151. doi: 10.1016/j.ijfoodmicro.2014.10.015. [DOI] [PubMed] [Google Scholar]
- 51.Bertrand I, Schijven JF, Sanchez G, Wyn-Jones P, Ottoson J, Morin T, Muscillo M, Verani M, Nasser A, de Roda Husman AM, Myrmel M, Sellwood J, Cook N, Gantzer C. 2012. The impact of temperature on the inactivation of enteric viruses in food and water: a review. J Appl Microbiol 112:1059–1074. doi: 10.1111/j.1365-2672.2012.05267.x. [DOI] [PubMed] [Google Scholar]
- 52.van Boekel MAJS. 2002. On the use of the Weibull model to describe thermal inactivation of microbial vegetative cells. Int J Food Microbiol 74:139–159. doi: 10.1016/S0168-1605(01)00742-5. [DOI] [PubMed] [Google Scholar]
- 53.Cunha LM, Oliveira FAR, Oliveira JC. 1998. Optimal experimental design for estimating the kinetic parameters of processes described by the Weibull probability distribution function. J Food Eng 37:175–191. doi: 10.1016/S0260-8774(98)00085-5. [DOI] [Google Scholar]
- 54.Van Boekel MAJS. 2008. Kinetics of inactivation of microorganism, p 1–42. In Kinetic modeling of reactions in foods. CRC Press, Taylor and Francis Group, New York, NY. [Google Scholar]
- 55.Van Zuijlen A, Periago PM, Amezquita A, Palop A, Brul S, Fernandes PS. 2010. Characterization of Bacillus sporothermodurans IC4 spores; putative indicator microorganism for optimisation of thermal processes in food sterilisation. Food Res Int 43:1895–1901. doi: 10.1016/j.foodres.2009.11.011. [DOI] [Google Scholar]
- 56.Peleg M, Normand MD, Corradini MG. 2012. The Arrhenius equation revisited. Crit Rev Food Sci Nutr 52:830–851. doi: 10.1080/10408398.2012.667460. [DOI] [PubMed] [Google Scholar]
- 57.Clark DS, Blanch HW. 1997. Biochemical engineering, 2nd ed CRC Press, New York, NY. [Google Scholar]
- 58.Watanabe T, Furukawa S, Hirata J, Koyama T, Yamasaki HOM. 2003. Inactivation of Geobacillus stearothermophilus spores by high-pressure carbon dioxide treatment. Appl Environ Microbiol 69:7124–7129. doi: 10.1128/AEM.69.12.7124-7129.2003. [DOI] [PMC free article] [PubMed] [Google Scholar]
- 59.Heldman D. 2011. Food preservation process design. Procedia Food Sci 1:685–689. doi: 10.1016/j.profoo.2011.09.103. [DOI] [Google Scholar]
- 60.Koopmans M, Duizer E. 2004. Foodborne viruses: an emerging problem. Int J Food Microbiol 90:23–41. doi: 10.1016/S0168-1605(03)00169-7. [DOI] [PMC free article] [PubMed] [Google Scholar]
- 61.Awuah GB, Ramaswamy S, Economides A. 2007. Thermal processing and quality: principles and overview. Chem Eng Process 46:584–602. doi: 10.1016/j.cep.2006.08.004. [DOI] [Google Scholar]
- 62.Doyle ME, Mazzotta AS, Wang T, Wiseman DW, Scott VN. 2001. Heat resistance of Listeria monocytogenes. J Food Prot 64:410–429. [DOI] [PubMed] [Google Scholar]
- 63.Gaze JE, Brown GD, Gaskell DE, Banks JG. 1989. Heat resistance of Listeria monocytogenes in homogenates of chicken, beef steak and carrot. Food Microbiol 6:251–259. doi: 10.1016/S0740-0020(89)80006-1. [DOI] [Google Scholar]