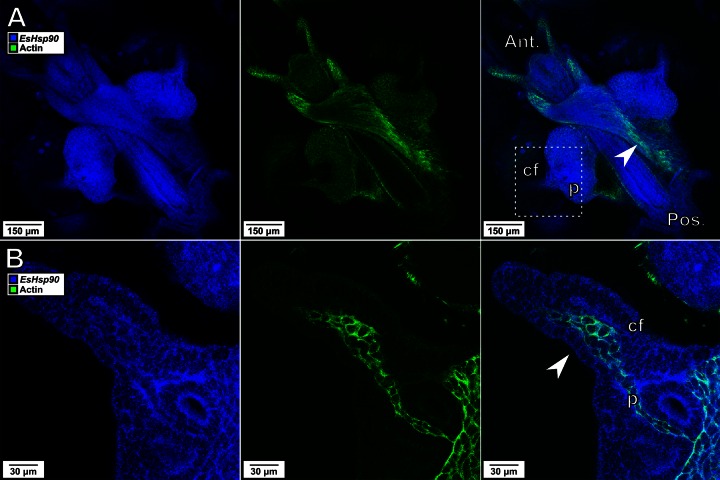
FIG 2.
Visualization of multiple transcripts within animal tissues. Representative images at ×10 (A) and ×40 (B) magnifications of the EsHsp90 transcript (blue) and the actin transcript (green) are shown. (A) The actin transcript is present throughout much of the light organ and strongly expressed in striated muscle (arrowhead). (B) In the enlarged area encompassed by the dashed box, the actin transcript is not detectable either in the ciliated field (cf) around the pore (p) or in the epithelium of the appendages, although it is easily observed in the vascular tissue within the appendage (arrowhead). In contrast to the actin transcript, the probe for the EsHsp90 transcript was detected strongly and uniformly throughout the appendages and ciliated field. Ant., anterior; Pos., posterior.

