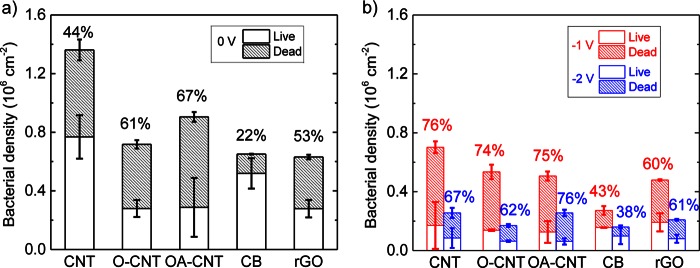
FIG 3.
Densities of live/dead bacteria on CNM coatings in the absence (a) and presence (b) of a total voltage of −1.0 V or −2.0 V. The analysis was carried out after 3 h of incubation at 30°C in a 0.9% NaCl saline solution in 1/8 TSB. Shaded sections of bars represent the densities of inactivated bacteria, and open sections represent the densities of live bacteria. The percentage of inactivated bacteria is given above each bar.

