
FIG 5.
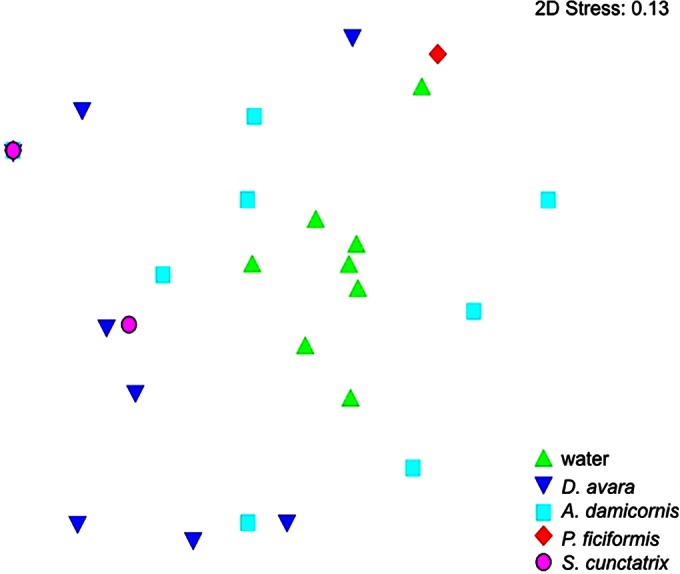
Nonmetric MDS plot based on the similarities of the nifH gene sequences obtained from water and sponge samples. The 8 symbols per sample represent 2 replicates for each 4 months; however, nifH genes were amplified in only 1 and 2 months for P. ficiformis and S. cunctatrix, respectively. (Note the overlapping of the symbols for S. cunctatrix, P. ficiformis, and A. damicornis at the left.)