
FIG 3.
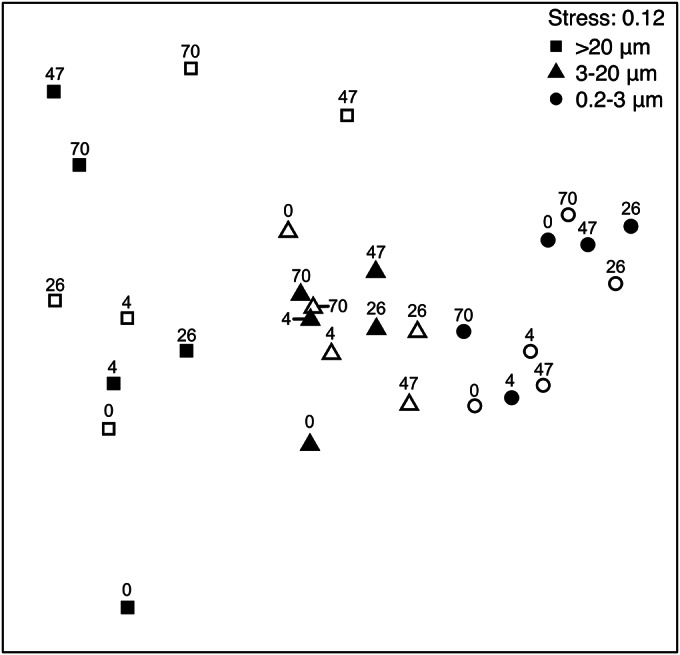
MDS plot of ARISA of Vibrio assemblages from the intensive-sampling experiment during a mixed-raphidophyte bloom in September 2011. Symbols are labeled with the collection time in hours. Open symbols, site 1; closed symbols, site 2.
Official websites use .gov
A
.gov website belongs to an official
government organization in the United States.
Secure .gov websites use HTTPS
A lock (
) or https:// means you've safely
connected to the .gov website. Share sensitive
information only on official, secure websites.
MDS plot of ARISA of Vibrio assemblages from the intensive-sampling experiment during a mixed-raphidophyte bloom in September 2011. Symbols are labeled with the collection time in hours. Open symbols, site 1; closed symbols, site 2.