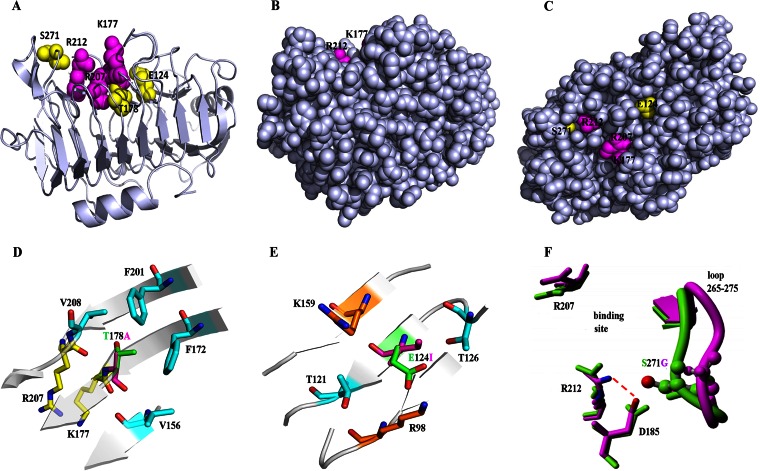
FIG 5.
Locations and structural analysis of three key mutation sites. (A) Mutations location in the crystal structure of BspPelA (PDB accession no. 3VMW). The side chains of the catalytic triad (K177, R207, and R212) and mutations (E124, T178, and S271) are represented as spheres. (B and C) Views of BspPelA with all residues in a real space with van der Waals representation, where the image in panel B is in an orientation identical to that of the image shown in panel A and panel C shows a 90°C turn of the image in panel B along the x axis. Only the respective side chains are shown in color, and the backbone is shown in gray. (D) Location and mutation of T178A. T178 and A178 are represented in green and purple, respectively. (E) Location and mutation of E124I. E124 and I124 are represented in green and purple, respectively. (F) Location and mutation of S271G. The H-bond network around Arg212 in the crystal structure of BspPelA is shown in green; S271G (last snapshot from a 10-ns MD simulation) is shown in purple.

