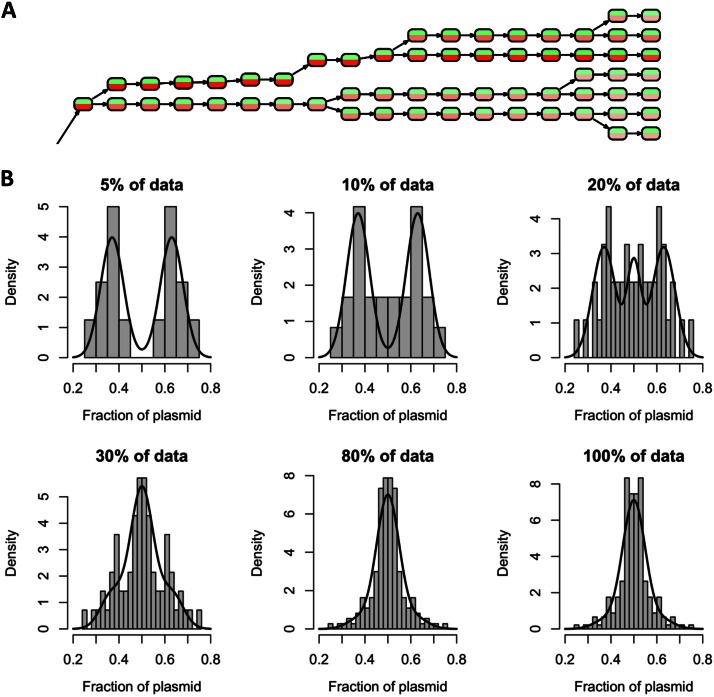
FIG 5.
(A) Part of the reconstructed cell lineage tree derived from a time lapse movie of B. megaterium carrying the pKMMBm2 plasmid (see Movie S3 in the supplemental material). Nodes represent single cells at specific time points. Red and green indicate the respective fluorescence intensities. The complete tree is available in Fig. S3 in the supplemental material. (B) Relationship of bimodal plasmid distribution to the amount of plasmid per cell. Histograms show the fraction of segregated plasmids in relation to the percentage of cells with the strongest XylR-mCherry signal (referred to as “% of data” in the heading of each diagram). Bimodal distributions were found for 5 to 20% of cells, all containing large amounts of XylR-mCherry. Fitted curves were generated using a mixture model consisting of the 10% of cells most highly fluorescing and the rest. Highly fluorescing cells were fitted using a binormal distribution superposition of two normal distributions, localized at 0.5 ± 0.13 (with a variance of 0.05). The remaining mother cells with low fluorescence were fitted to one normal distribution (with a mean of 0.5 and a variance of 0.03).

