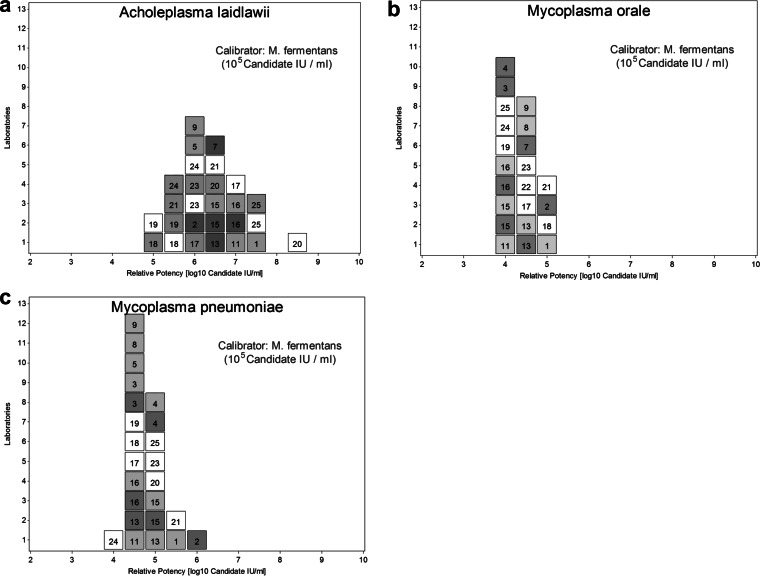
FIG 3.
The distribution of candidate numbers of IU per milliliter was calculated for (semi)quantitative assays (assays 1 to 16; dark gray squares, calculations based on the reported numbers of copies per milliliter; light gray squares, calculations based on CT values) and for qualitative assays (assays 17 to 25). The assay number (Table 2) is included in each box. All calculations were based on M. fermentans preparations with an arbitrary concentration of 105 candidate IU/ml (panel member 8) or 103 candidate IU/ml (panel member 2). The harmonization of the assays by a common calibrator is obvious by the closer distribution of the test results in IU per milliliter, e.g., compared to the distribution of numbers of copies per milliliter reported by quantitative assays (Fig. 1). Calculations were performed for the preparations containing A. laidlawii (a), M. orale (b), or M. pneumoniae (c). For A. laidlawii, calculations for qualitative assays (assays 17 to 25) were performed both for the neat concentration (panel member 9), represented as gray boxes, and for the 1:100 dilution (panel member 1), represented as white boxes.

