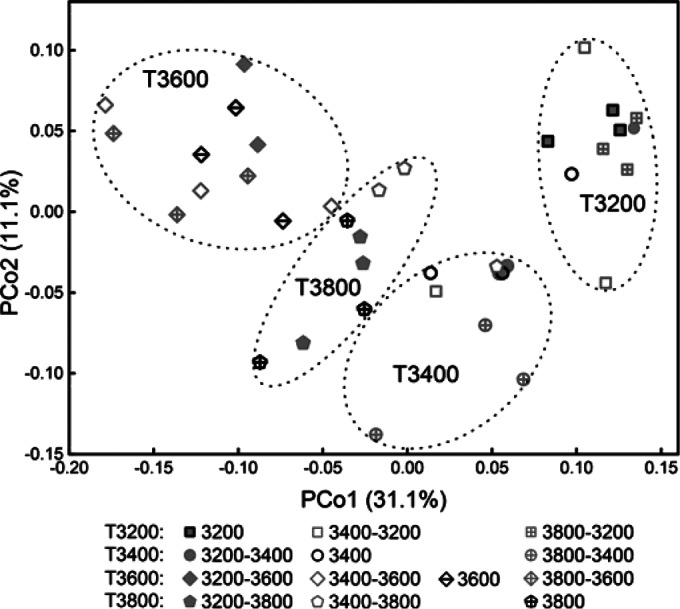
FIG 1.

PCoA score plot of transplant samples (gray-edge symbols) and their controls at “home” sites (black-edge symbols) based on weighted UniFrac metrics. Values on PCoA axes indicate the percentages of total variation explained by each axis. Samples were named by their elevations or transplanted to other elevations, e.g., sample 3200 means that it was collected in a “home control” block at the elevation of 3,200 m; sample 3200-3400 means that soil was collected from a plot transplanted from 3,200 m to 3,400 m. T3200 means the group samples collected at the elevation of 3,200 m from both transplanted and “home control” blocks. The relative abundances of OTU were used as input in the analysis.
