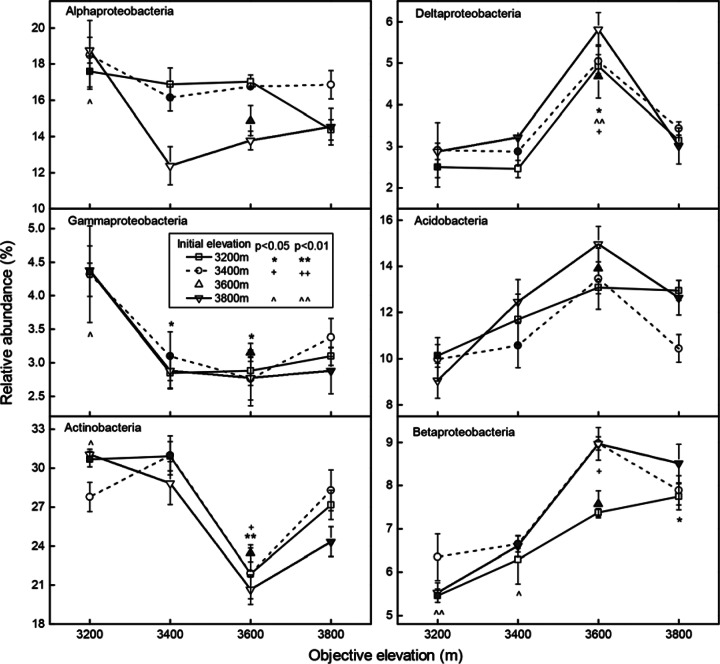
FIG 2.
Changes in the dominant bacterial groups (i.e., the percentage compared to the total number of reads) at the phylum or class level along the elevational gradient. Significant differences between the transplant samples (open symbols) and their controls at “home” sites (filled symbols) were calculated by ANOVA. Means ± the standard errors are shown in the figures.

