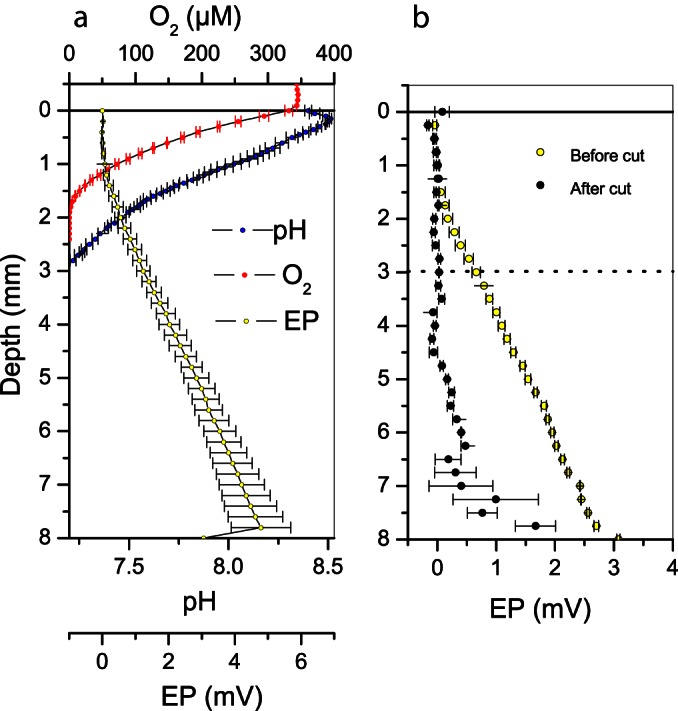
FIG 4.

Depth distribution of EP, oxygen, and pH at the exposed bank of Giber Å. (a) In situ profiles of EP (yellow), oxygen (red), and pH (blue). (b) In situ cut experiment. EP profiles measured before the cut was performed (green), EP profiles measured after dragging a nylon string horizontally through the sediment 3 mm below the sediment surface (black). The dashed line illustrates the vertical position of the cut. Error bars represent standard errors of the mean for three replicate profiles.
