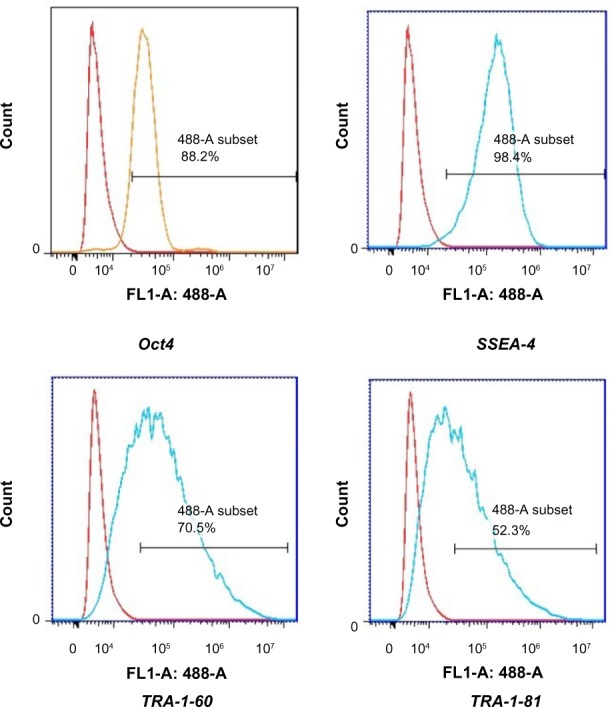
Figure 7.

Flow cytometric analysis of the indicated markers in iPSCs.
Notes: The red histograms represented the negative peak curve and the blue histograms represented the positive peak curve. The horizontal line stood for the positive rate of detected cells.
Abbreviation: iPSCs, induced pluripotent stem cells.
