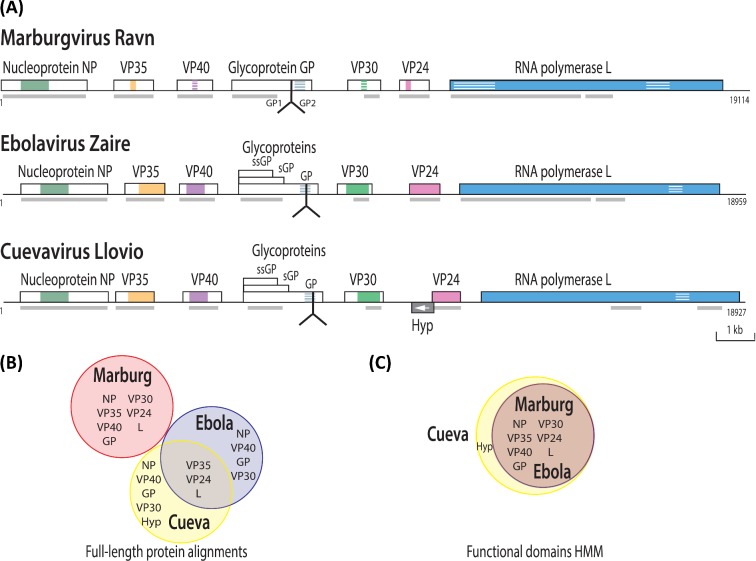
Figure 3.
Gene organization of filovirus genomes and pan-core proteome analysis. (A) Gene organization of viruses from genera Marburgvirus, Ebolavirus and Cuevavirus. Conserved regions are indicated by color, with striped color for weak conservation. The furin cleavage site for glycoprotein GP is indicated by the inverted Y-shaped symbol. Gray blocks below the line indicate the position of conserved functional domains (predicated by InterProScan; Jones et al. 2014). (B) Venn diagram summarizing the results of the pan-core analysis based on protein sequence alignments with a cut-off based on the 50–50 rule (see the text). (C) Venn diagram of the protein functional domains resulting from pan-core analysis based on HMM.

