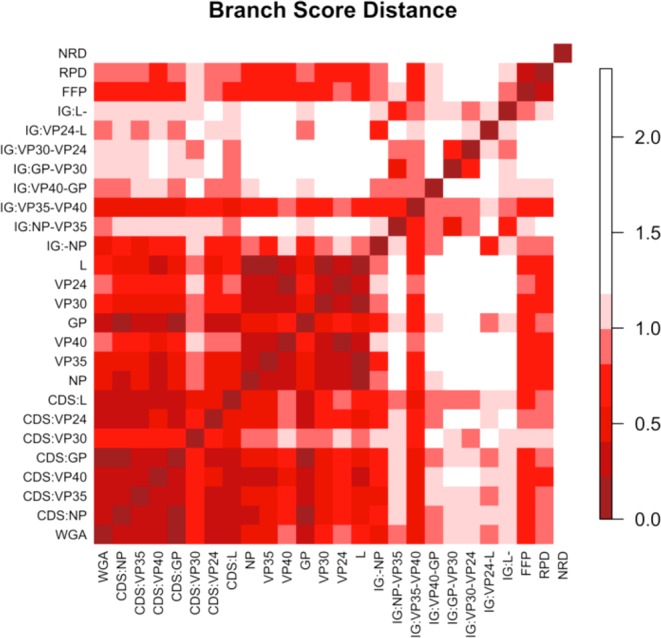
Figure 7.

Ebolavirus trees comparison. This is an image plot of branch score distances between alignment-based trees constructed by different features including whole genome alignment (WGA), coding gene sequences (CDS), intergenic (IG) sequences, protein sequences and three alignment-free-based whole genome trees by FFP, NRD and RPD.
