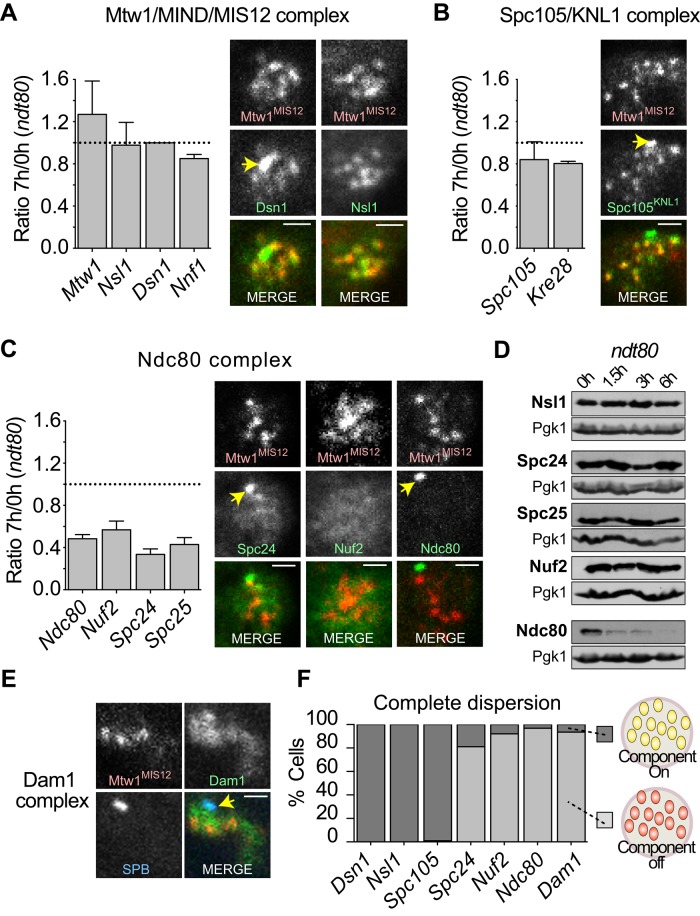
FIGURE 3:
Behavior of the KMN network and Dam1 complex during early stages of meiosis I. (A–C) MS-SRM was used to determine the relative levels of proteins at pachytene relative to meiotic entry (three independent experiments), and fluorescence microscopy was used to visualize individual components tagged with GFP. Kinetochores were marked by Mtw1-3xmCherry, and SPBs by were marked by Spc42-CFP. (A) Mtw1 complex, Dsn1-GFP, and Nsl1-GFP. (B) Spc105 complex, Spc105-GFP. (C) Ndc80 complex, Spc24-GFP, Nuf2-GFP, and Ndc80-GFP. (D) Western blot analysis of the levels of GFP-tagged Ndc80 complex components. Samples were harvested from synchronous cultures, and extracts were prepared from samples harvested at the times indicated after meiotic induction. Blots were probed with antibodies against Pgk1 (loading control) and GFP. (E) Fluorescence microscopy examination of Dam1-GFP disposition in pachytene. (F) Quantification of fluorescence microscopy data (n ≥ 100). The yellow arrows indicate SPB marker when present. Scale bars, 1 μm.

