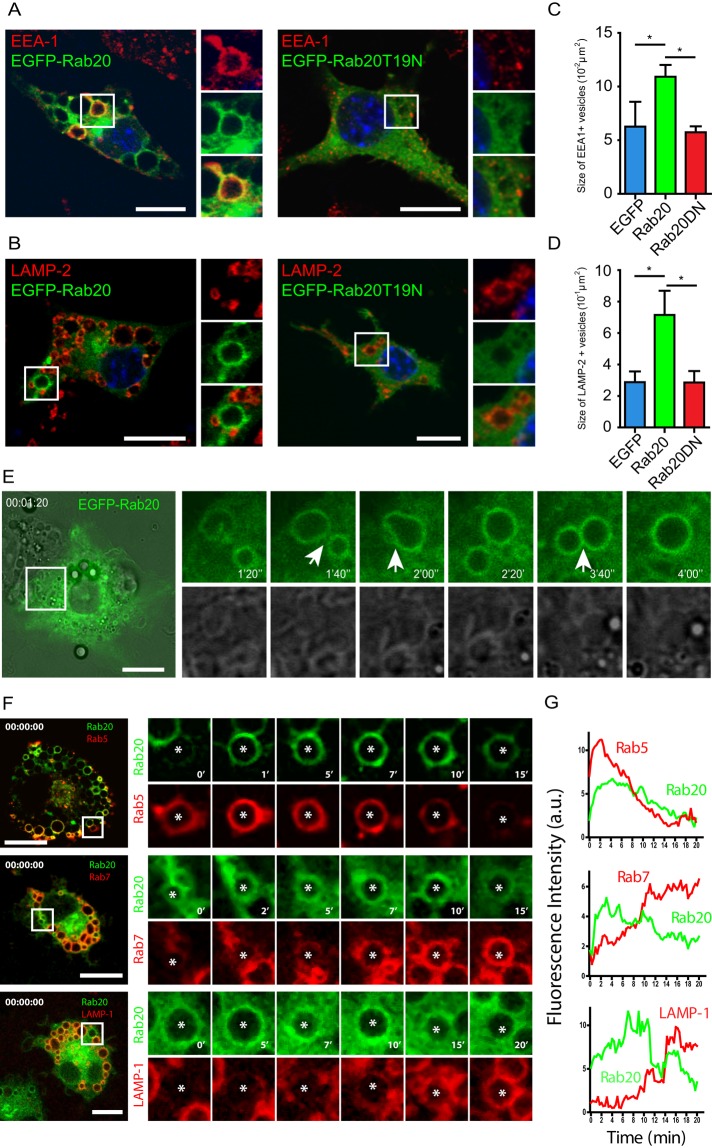
FIGURE 2:
EGFP-Rab20 expression induces the enlargement of early and late endosomes in macrophages. Cells were transfected with EGFP-Rab20 or EGFP-Rab20T19N and subsequently immunolabeled for (A) the early endosomal marker EEA-1 or (B) the late endosomal marker LAMP-2. Nuclei were stained with Hoechst 33258 and are shown in blue. Insets show regions of interest indicated by the white rectangles. Scale bar, 10 μm. Quantitative analysis of the size of (C) early and (D) late endosomes in EGFP–, EGFP-Rab20–, or EGFP-Rab20T19N–expressing RAW264.7 macrophages. For each group, at least 20 cells were analyzed. Data show mean ± SD of three independent experiments. The p values were calculated using Student's two-tailed t test. *p ≤ 0.05. (E) Left, snapshot of RAW264.7 macrophages expressing EGFP-Rab20 analyzed by live-cell imaging. Scale bar, 10 μm. Right, the process of homotypic fusions between Rab20-positive endosomes. White arrows indicate fusion events. (F) Left, snapshots at time 0 of RAW264.7 macrophages coexpressing mCherry- or EGFP-Rab20 with EGFP-Rab5, EGFP-Rab7 (pseudocolored in red), and tdTomato-LAMP-1; white squares show zoomed-in areas on the right. Right, zoomed snapshots at the indicated time points of vesicles (asterisks). Scale bar, 10 μm. (G) The kinetics of Rab20 and Rab5, Rab7 or LAMP-1 association with endosomes shown in F.

