
Figure 2.
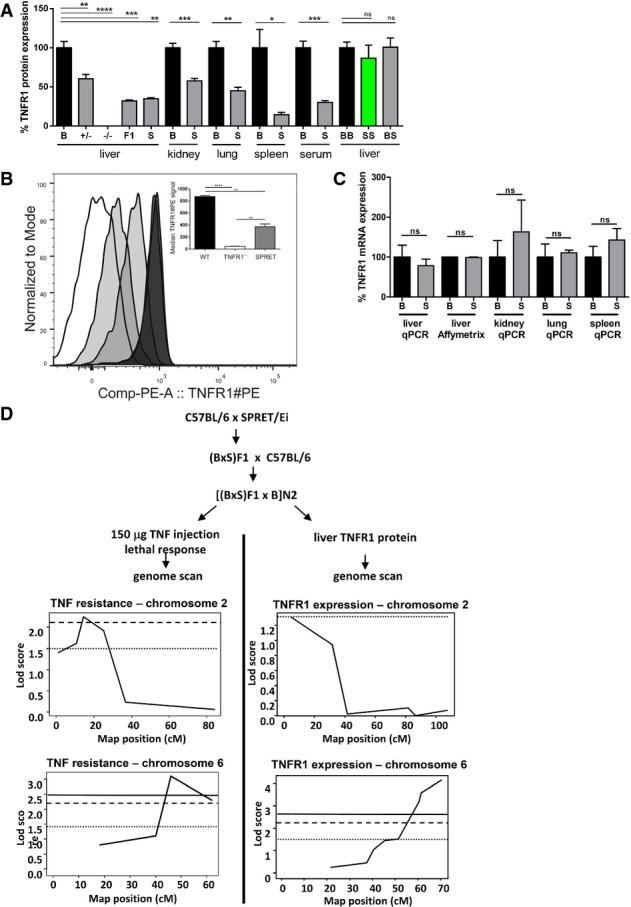
Reduced TNFR1 protein levels in S mice and genetic linkage study of this trait
- TNFR1 protein levels in serum and tissues of different mouse groups (n = 4–13). TNFR1 protein levels were measured by ELISA and compared to B, the levels of which were set as 100% for each tissue. From left to right: B mice (black), TNFR1+/- mice (grey), (BxS)F1 mice (grey), S mice (grey); B.S-chr6-BB (black), B.S-chr6-SS (green) and B.S-chr6-BS (grey).
- TNFR1 expression in splenic neutrophils of wild-type, TNFR1 KO and SPRET mice determined by FACS. Neutrophils were defined by flow cytometry (FACS) as SSChighCD11b+Ly6GhighLy6Cmid and TNFR1+ cells from different strains were plotted in a histogram. In the insert, the median of TNFR1-PE signals were plotted and this shows that SPRET mice have an intermediate TNFR1 expression compared to WT mice.
- TNFR1 mRNA levels measured by qPCR in organs of B (n = 3) and S (n = 4). Affymetrix microarray data from hepatocytes (Affy Mo Gene 1.0 ST Array).
- Backcross experiments in mice to determine genetic linkage between TNF resistance (left) and TNFR1 liver protein levels (right). QTL mapping of lethal response (n = 178) was based on the data previously obtained and discussed by Staelens et al (2002), but the data were re-analysed in the current study using R/qtl software. TNFR1 protein level in the liver of N2 mice (n = 214). For both TNF resistance and TNFR1 levels, the LOD scores show a QTL on chr2 (TNF resistance 15 cM, LOD = 2.25 and TNFR1 levels 5 cM, LOD = 1.31) and chr6 (TNF resistance 46 cM, LOD = 3.11 and TNFR1 levels 70 cM, LOD = 4.15). Horizontal lines in the figures represent LOD values that are suggestive (dots), significant (stripes) and highly significant (full line).
Data information: Data are presented as mean ± SE. Student’s t-test using unpaired comparisons and two-tailed analysis. *P < 0.05, **P < 0.01, ***P < 0.001, ****P < 0.0001.