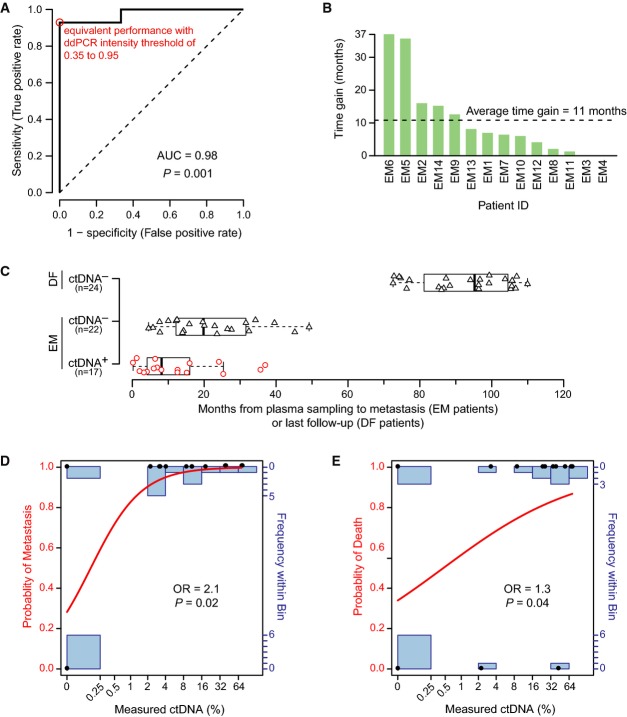
Figure 5.
ROC analysis, time gain, and clinical outcome
- Receiver operating characteristic (ROC) curve analysis. The area under the curve (AUC) as a measure of the postsurgery classification accuracy to discriminate between 6 long-term disease-free (DF) and 14 eventual metastasis (EM) patients based on ctDNA is 0.98 (95% CI 0.75–1.00; P = 0.001, two-sided Mann–Whitney U-test). The sensitivity and specificity were maximal (red circle) at all ddPCR relative fluorescence intensity thresholds between 0.35 and 0.95 (on a normalized scale from 0 to 1). The dashed line indicates a hypothetical test with performance no better than random.
- Time gained by ctDNA-based detection of recurrence in advance of clinically detected recurrence for all patients with clinical recurrence. For 12 out of 14 EM patients, ctDNA-based recurrence preceded clinical recurrence (time gain greater than zero).
- Boxplots indicating the time from a positive (red circles) or negative ctDNA plasma sample (black triangles) until an event, metastasis or last follow-up, for EM and DF patients. Box indicates the interquartile range (IQR), thick bar indicates the median, and whiskers extend to values within 1.5 times the IQR.
- Fitted curve from logistic regression with metastasis as endpoint. Measured ctDNA percentage and actual outcomes are indicated by black dots, the modeled probability is given by the red curve (left axis), and the number of measured data points in each bin is indicated by the blue bar graphs (right axis). Logistic regression odds ratio (OR) of 2.1 (95% CI 1.3 to infinity; P = 0.02, Wald test) is for each doubling of ctDNA.
- Fitted curve from logistic regression with death as endpoint. OR of 1.3 (95% CI 1.03-1.9; P = 0.04, Wald test) is for each doubling of ctDNA.

