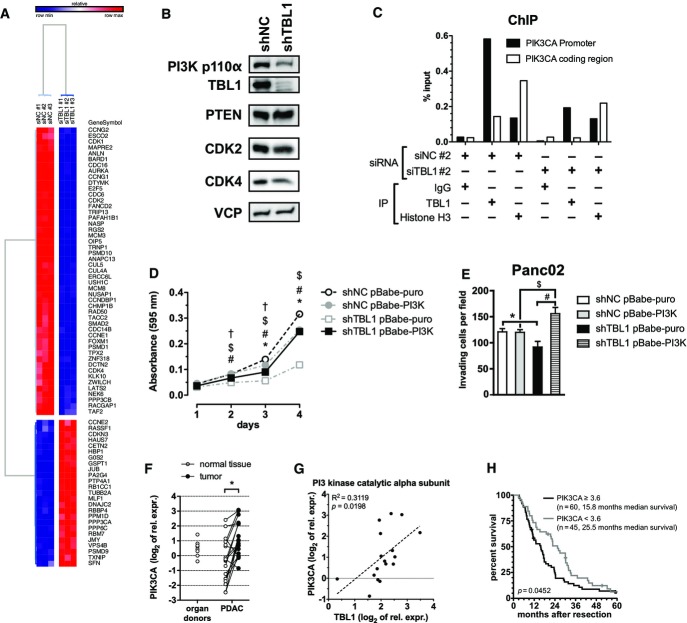
Figure 3.
TBL1 controls PI3 kinase signaling by direct transcriptional regulation
- Gene expression microarray from Capan-1 cells transfected with siRNA. Heatmap shows genes annotated to KEGG pathway hsa04110 “Cell Cycle” and/or gene ontology cluster GO:0007049 “Cell Cycle”.
- Protein expression of Panc02 cells with stable shRNA expression prior to implantation into mice.
- Chromatin immunoprecipitation from Capan-1 cells with or without siRNA-mediated knockdown of TBL1. IgG and primers for PIK3CA coding region served as a negative control; histone H3 served as a positive control.
- Proliferation time course assay in control and TBL1 shRNA-transfected Panc02 cells overexpressing constitutively active PI3K p100α mutant E545K. Cells were stained with crystal violet, and absorbance was measured at 595 nm. n = 9 cell culture wells per group; statistically significant at P < 0.05 for indicated comparisons: shNC pBabe-puro vs. shNC pBabe-PI3K (*), shTBL1 pBabe-puro vs. sbTBL1 pBabe-PI3K (#), shNC pBabe-puro vs. shTBL1 pBabe-puro ($), shNC pBabe-PI3K vs. shTBL1 pBabe-PI3K (†); P-values: day 2: 2.01 × 10⁻³ (#), 4.11 × 10⁻⁹ ($), 5.77 × 10⁻³ (†); day 3: 4.50 × 10⁻⁵ (*), 1.01 × 10⁻⁹ (#), 1.71 × 10⁻³⁰ ($), 1.22 × 10⁻⁶ (†); day 4: 5.61 × 10⁻²² (*), 1.10 × 10−45 (#), 6.65 × 10−62 ($); two-way ANOVA with Bonferroni post-test.
- Matrigel invasion assay in same cells as in (D). Invading cells per microscopy field were counted. n = 6 microscopy fields per group; statistically significant at P < 0.05; P-values: 6.64 × 10⁻⁴ (*), 1.35 × 10⁻⁷ (#), 6.94 × 10⁻⁵ ($); two-way ANOVA with Bonferroni post-test.
- mRNA expression of PIK3CA in human patient samples; significant difference (P < 0.05) between tumor and normal tissue *P = 2.13 × 10⁻⁴ determined by paired two-tailed Student’s t-test, n = 18 patients.
- Correlation of mRNA expression of TBL1 and PIK3CA in human patient tumor tissue (normalized to 18S rRNA and relative to a pooled organ donor sample); n = 17 patients; P-value determined by testing for slope of regression line ≠ 0.
- Survival analysis in 105 patients with PDAC: High PIK3CA expression is significantly associated with shorter post-resection survival. P-value determined by log-rank test as described in Materials and Methods.
Data information: Data in (D) and (E) plotted as mean ± SEM.

