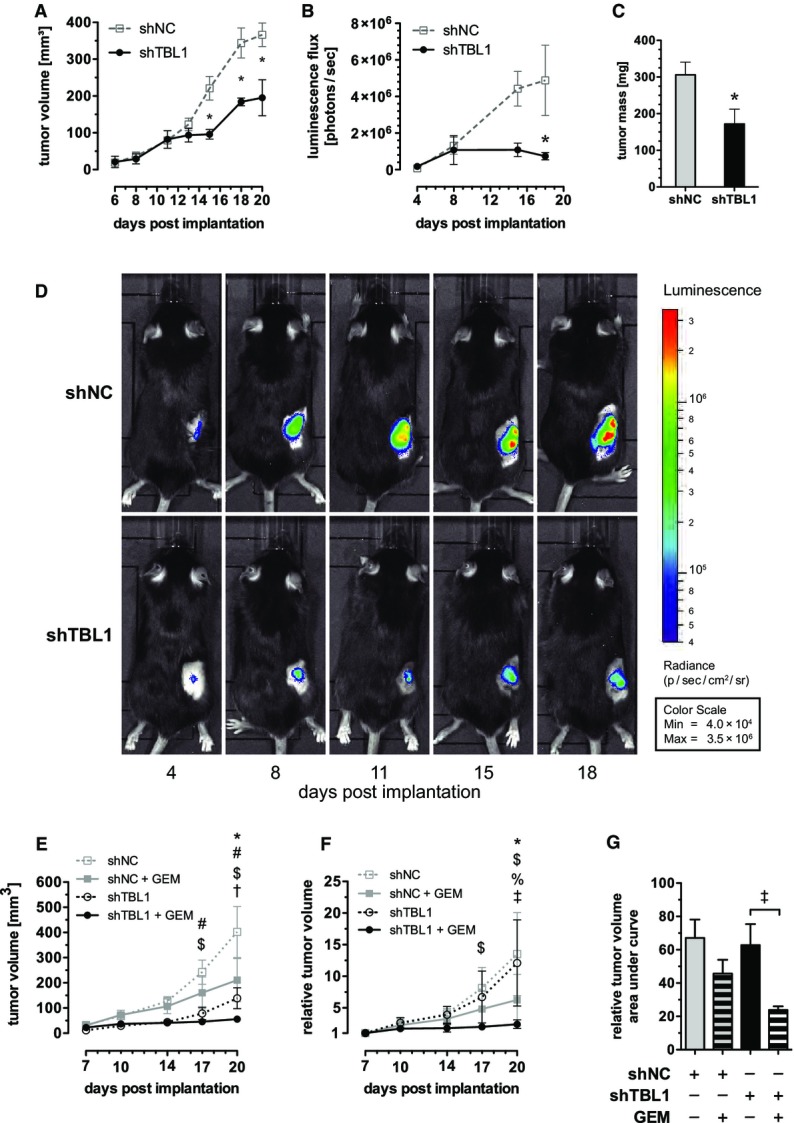
Figure 4.

TBL1 reverses and prevents tumor growth in vivo and sensitizes toward chemotherapy
- A–D Panc02 cells with stable expression of luciferase were implanted subcutaneously into C57Bl6/N mice. Six days later, tumors were injected three times per week with 108 ifu of adenovirus encoding shRNA. (A–C): Data plotted as mean ± SEM; n = 4 animals in control (shNC) group and n = 3 animals in knockdown (shTBL1) group; significantly different (P < 0.05) between control (shNC) and knockdown (shTBL1) *. (A) Tumor volume determined by transcutaneous measurement with digital calipers; P-values: 9.21 × 10⁻³ at day 15, 6.02 × 10⁻⁴ at day 18, 2.49 × 10⁻⁴ at day 20; two-way ANOVA with Bonferroni post-test. (B) Luminescence of tumors after intraperitoneal injection of firefly d-luciferin; P = 0.0133 at day 20; two-way ANOVA with Bonferroni post-test. (C) Tumor mass at necropsy; P = 0.0299, one-sided Welch’s t-test. (D) Luminescence images of one representative mouse in each group.
- E–G Panc02 cells with stable expression of shRNA were implanted subcutaneously into C57Bl6/N mice. Seven days later, mice were treated with 20 mg/kg gemcitabine delivered by intraperitoneal injection; n = 4 animals in shNC+GEM group, n = 5 animals in all other groups; significantly different (P < 0.05) between groups: shNC vs. shNC+GEM (*), shNC vs. shTBL1 (#), shNC vs. shTBL1+GEM ($), shNC+GEM vs. shTBL1 (%), shNC+GEM vs. shTBL+GEM (†); shTBL1 vs. shTBL1+GEM (‡); two-way ANOVA with Bonferroni post-test. (E) Tumor volume determined by transcutaneous measurement with digital calipers. P-values: day 17: 8.48 × 10⁻³ (#), 1.07 × 10⁻³ ($), day 20: 3.07 × 10⁻³ (*), 9.37 × 10⁻⁶ (#), 1.56 × 10⁻⁸ ($), 0.0239 (†). (F) Tumor volume relative to the volume at day 7 post-implantation; P-values: day 17: 3.94 × 10⁻³ ($), day 20: 1.09 × 10⁻³ (*), 1.39 × 10⁻⁷ ($), 0.01195 (%), 3.12 × 10⁻⁶ (‡). (G) Area under curve for relative tumor volume; P = 0.0195 (‡).
Data information: All data plotted as mean ± SEM.
