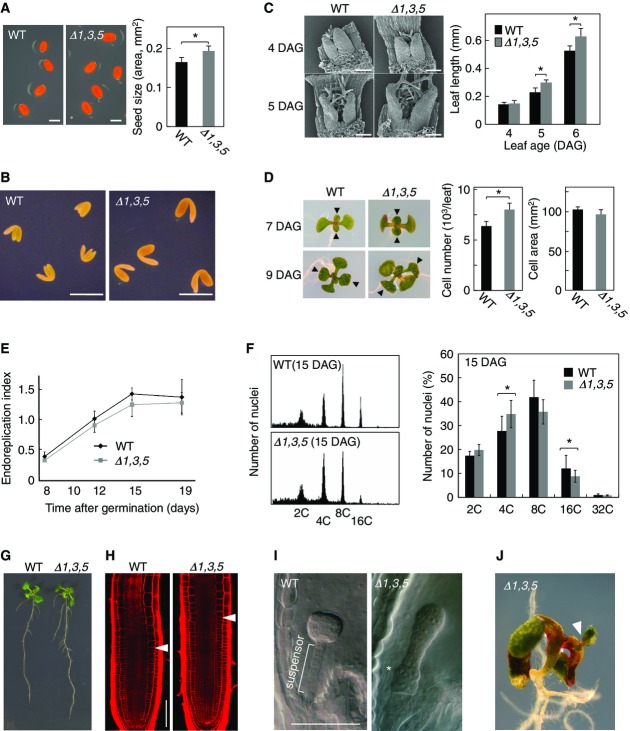
Figure 7.
Loss of repressor MYBs causes enhanced organ growth and ectopic cell division
- Increased seed size of myb3r1/3/5 triple mutant. The average seed area after imbibition was determined (n = 25).
- Enlarged embryo of a myb3r1/3/5 triple mutant.
- Enhanced leaf growth at the initial stage of leaf development in myb3r1/3/5 triple mutant. SEM images of initiating first leaf pairs at 4 and 5 DAG are shown. A graph shows the average length of initiating leaves of wild-type and myb3r1/3/5 seedlings (n = 6).
- Increased cell number causes greater leaf size in myb3r1/3/5 triple mutants at the early seedling stage. Images show whole seedlings of wild-type and myb3r1/3/5 plants at 7 and 9 DAG. First leaf pairs are indicated by arrowheads. Graphs show that, at 7 DAG, the difference in the number of palisade cells per leaf, but not their size, is statistically significant (n = 5).
- Time-course changes of ploidy levels in first leaf pairs of wild-type and myb3r1/3/5 seedlings. The levels of ploidy are expressed by the value called “endoreduplication index,” which represents the average number of endoreduplication cycles that were experienced by the cells (n = 5).
- Ploidy distribution of first leaf pairs at 15 DAG. Representative results of flow cytometric analysis (left) and ploidy distributions (right) of wild-type and myb3r1/3/5 plants are shown (n = 5).
- Root phenotypes in wild-type and myb3r1/3/5 plants. Images show seedlings at 6 DAG.
- Increase in meristem size in myb3r1/3/5 roots. Images show propidium-iodide-stained roots at 5 DAG. Arrowheads indicate the basal end of the root meristem, which was determined by the position at which the cells start elongating.
- Ectopic cell division during myb3r1/3/5 embryo development. A cell clump was formed in suspensor of myb3r1/3/5 embryo (asterisk).
- An ectopic shoot apical meristem generated in a myb3r1/3/5 seedling.
Data Information: WT, wild type; Δ1,3,5, myb3r1/3/5 triple mutant. Scale bars: 500 μm in (A) and (B), and 100 μm in (C), (H), and (I). In all panels, error bars represent SD. The asterisks in the graphs show differences that are statistically significant (t-test P-value < 0.05).

