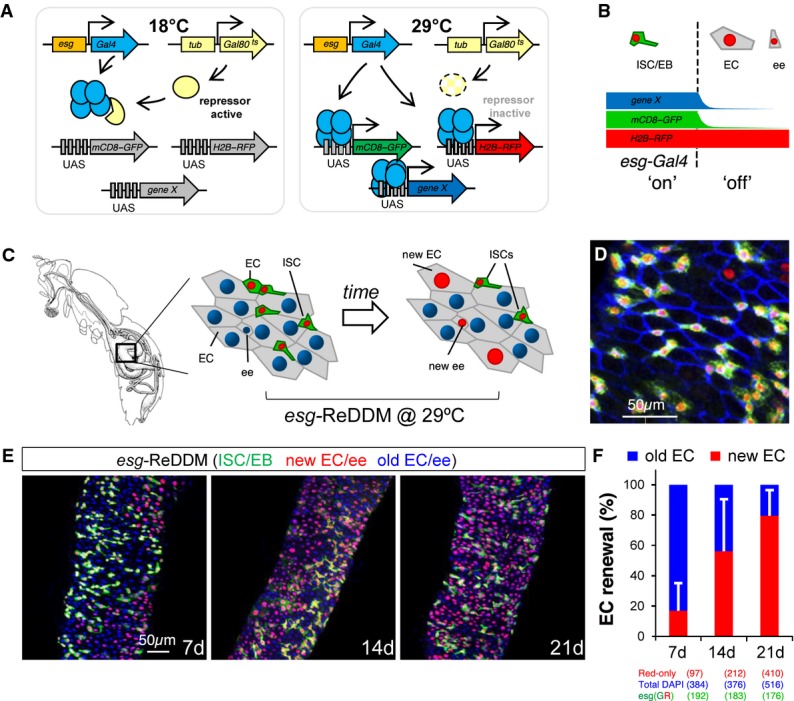
Figure 1.

The ReDDM principle for marking and manipulating precursor cells and simultaneous view of the cell turnover at single-cell resolution
- Schematic illustration of the transgenes used in ReDDM (repressible dual differential stability markers) combined with the esg-Gal4 and a transgene (UAS-gene X) for mis/overexpression or downregulation via RNAi.
- The ReDDM relies on the differential protein stabilities of a pair of fluorescent proteins: the short-lived mCD8-GFP (green) serves as a morphological and an accurate temporal marker of the Gal4 activity (e.g. esg-Gal4), while the long-lived H2B-RFP (red) allows for tracing any newly differentiated progeny derived from the esg-Gal4 cells. The esg-Gal4 drives expression in the ISCs and enteroblasts (EBs) and is turned off in terminal differentiated EC (enterocyte) and ee (enteroendocrine) cells.
- Images illustrate the unlabelled (grey) adult Drosophila melanogaster gut and the esgReDDM-labelled midgut just after the temperature shift (left scheme) and 7 days later (right scheme).
- Representative confocal image from the midgut 7 days after temperature shift. Blue staining (anti-Discs-large-1, a-Dlg-1) outlines the intestinal epithelial cell membranes. Any newly generated differentiated progeny is highlighted by the nuclear H2B-RFP (red) label, while differentiated cells lasting in the midgut epithelium are unlabelled and visualized by counterstaining with DAPI or outlined by a-Dlg-1.
- Intestinal cell renewal (visualized as red-retaining labelling cells) in midguts 7, 14 and 21 days after the temperature shift.
- The graph shows the quantification of posterior midgut cell renewal (red/unlabelled EC and ee cells) ratio over time using ReDDM in the homeostatic midguts shown in (E). Red bars (new EC and ee cells) and blue bars (old EC and ee), detected by 4′,6-diamidino-2-phenylindole (DAPI, blue) counterstaining. Error bars represent standard deviation of the mean.
Source data are available online for this figure.
