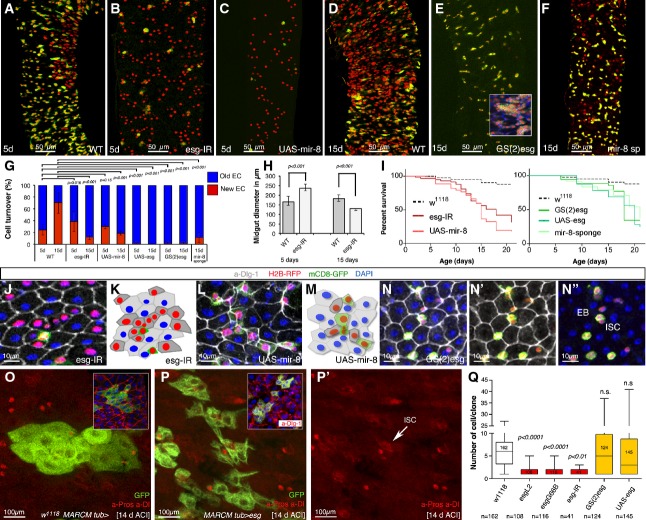
Figure 3.
The microRNA miR-8 and Escargot have opposing effects in controlling deferral versus terminal differentiation decision
- A–F Representative ReDDM in esg-Gal4 midguts of the indicated genotypes 5 or 15 days after the temperature shift that activates Gal4. (A) Intestinal renewal occurs in a patchy pattern indicating local demand. (B, C) Precocious differentiation of esg+ cells upon escargot depletion in esg+ cells (esgReDDM UAS-esg-IR, B) or upon misexpression of the mir-8 microRNA (esgReDDM UAS-mir-8, C). (D–F) ISCs and progenitor cells overexpressing escargot in the esg+ pattern (esgReDDM GS(2)esg, E) or with depleted mir-8 (esgReDDM UAS-mir-8-sponge, F) fail to exit the undifferentiated state, or their terminal differentiation was severely impaired, respectively. The control gut had renewed almost 75% of their enterocytes at the time point shown (2 weeks after temperature shift, D). Inset in (E) shows tumour-like accumulations of undifferentiated cells. The penetrance of all shown phenotypes is nearly 100%, and shown are representative images.
- G Quantification of intestinal cell replenishment as a ratio of new EC/old EC (red-only DAPI/”colourless” DAPI cells) in each genotype at the time point indicated. Error bars represent the standard deviations (SD) (n = 13 control guts scored for day 5 and n = 10 for day 15; n = 11 midguts (day 5) and n = 9 (day 15) for esg-IR; n = 6 (day 5) and n = 6 (day 15) for UAS-mir-8; n = 11 (day 5) and n = 11 (day 15) for GS(2)esg; n = 8 (day 5) and n = 7 (day 15) for UAS-mir-8-sponge). Unpaired t-test values are shown.
- H The graphs show the diameter of control (WT, n = 5 midguts (day 5) and n = 8 (day 15)) and escargot RNAi (esg > esg-IR: n = 8 (day 5) and n = 9 (day 15)) ReDDM-based midguts at the time point indicated. Error bars represent SD, and t-test values are shown.
- I Survival (as percentage of animals) over time of the indicated transgenes expressed under the esg-Gal4 control. Survival curves were constructed combining data from at least 10 vials, each with 10–15 flies, in a genotype group. Log-rank (Mantel–Cox) analysis indicated that escargot and mir-8 manipulations significantly reduced animal survival (P < 0.001).
- J–N (J) Precociously differentiated esg > esg-IR mutant ISC/EB cells are smaller than normal enterocytes, but integrate correctly into the epithelium. (L) Precociously differentiating mir-8 overexpressing ISC/EB intercalate incorrectly and amassed in the epithelium. Mature epithelial cells are marked by a-Dlg-1 (grey). (K, M) show schematic illustrations of the gut epithelium from the indicated genotypes. (N–N″) The escargot-overexpressing (esgReDDM GS(2)esg) progenitor cells have a more rounded shape than wild-type progenitor cells but can be distinguished from their mother ISCs by their larger size (N″).
- O, P MARCM tub-Gal4 clones at day 14 ACI of control midguts (O) and overexpressing escargot cells (P). Insets show clones of the cells of the indicated genotype where mature cells are visualized by their labelling by Dlg-1 (red). (P′) Single-channel image illustrates that escargot-overexpressing clones contain enteroendocrine cells (nuclear red, a-Pros) and ISC (cytoplasmic red, a-Dl: arrowhead).
- Q Box plot of clonal size in MARCM tub-Gal4 of the indicated genotypes in midguts 7 days after clone induction. Median value is shown. Student’s t-test indicated that the number of cells (size) in escargot overexpression clones were not significantly (n.s.) different from that in control (w1118 MARCM tub-Gal4) clones, while clones with depleted escargot were significantly different from those in control as assessed using ANOVA. P-values and number of clones scored are indicated in the corresponding bars.
Source data are available online for this figure.

